“Quick - Close the elevator!” you gasp as you race between the already closing doors. Although your officemate is suspicious, he dutifully presses the CLOSE button again. Once the doors have closed, you breathe a huge sigh of relief. You’ve successfully avoided your manager for the fifth time today.
Knowing that you can’t run from your manager forever, you return to your desk to start writing the report he requested. The first article in SSRS in a Flash prepared you for what SQL Server Reporting Services is all about, but it’s time to start development. The second article will start by discussing the advantages and disadvantages of different development environments, move into creating a new report, and wrap up by walking through all of the aspects of your development environment. Let’s begin with a discussion of the development environment options available to you.
How do you get started?
Before we can begin creating a report, we need to select one of two development tools: Report Builder or Business Intelligence Development Studio. Our decision is based on a variety of factors, including our skill set, permissions, and what we are trying to accomplish. Let’s look at each development tool in more detail.
Report Builder
As of SQL Server 2008 R2, Report Builder has gone through three iterations, which brings us up to Report Builder 3.0. Figure 1 shows an empty report in the Report Builder application.

Figure 1. Report Builder 3.0
You can open Report Builder through the Start Menu if it has already been downloaded. If not, you can download Report Builder as a ClickOnce application through the Report Server. In the case of SharePoint integrated mode, this can be done through the report library, and in the case of native mode, this can be done through Report Manager.
Report Builder allows business analysts and information workers to create reports for ad-hoc analysis or to distribute reports by uploading to the Report Server. Report Builder uses the Office 2007 ribbon format as to be friendlier to an Office user. Unfortunately, there is no integration between Report Builder and a source control system. To manage report versions and recovery, you can directly add a report to the repository.
A few distinguishing factors of Report Builder are shared report items and deployment scenarios. First of all, Report Builder reports can either use shared data sources that have already been published by a DBA or use an embedded data source, which is specific to that report only. Users of Report Builder can also import objects from the report gallery. Secondly, reports can either be deployed directly to the Report Server, assuming the user has the correct permission, or the files can be saved to a local directory to be uploaded and run at a later time. Let’s move on to the Business Intelligence Development Studio.
Business Intelligence Development Studio
Developers can also use the Business Intelligence Development Studio (BIDS) to design and develop reports. A new report in BIDS can be seen in Figure 2.
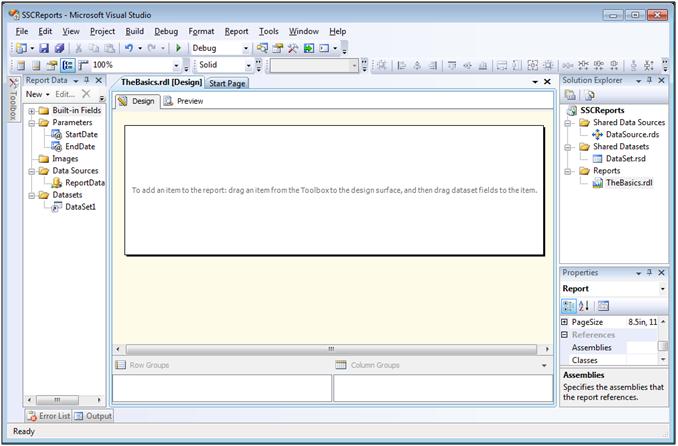
Figure 2. Business Intelligence Development Studio
BIDS, which installs during the SQL Server client tool installation, is actually the Visual Studio application with business intelligence project types installed. Because we use the Visual Studio environment, we use solution, projects, and items to set up our environment. We can also hook Visual Studio directly to source control solutions, such as Visual SourceSafe or Team Foundation Server. Because these aspects of BIDS tend to be more developer centric, the environment can be a little too busy for a business analyst.
Now that we know some of the pros and cons of using one development tool over the other, let’s look at the design environment of BIDS. Although we will use BIDS for this article, we will switch back and forth between BIDS and Report Builder when appropriate in the future.
Let’s Begin!
You can run BIDS through the Start menu, under the Microsoft SQL Server <version> folder. You can see the location in Figure 3. Note that it may be necessary to run the application using Administrator permissions, depending on your operating system.
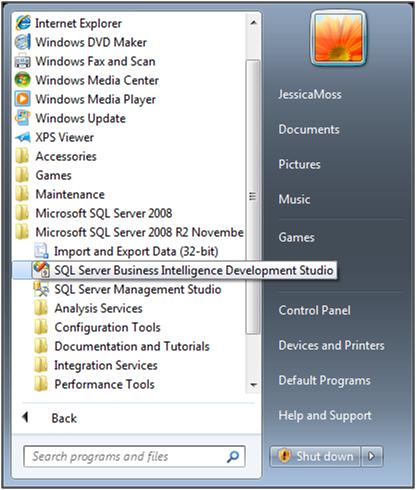
Figure 3. Start Business Intelligence Development Studio
Once BIDS opens, create a new project by going to the File menu -> New option -> Project selection. You will see the menu as shown in Figure 4.
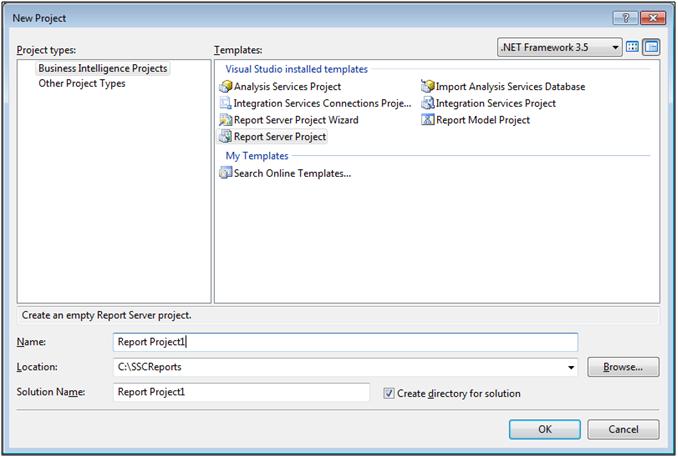
Figure 4. New Project Window
You have three reporting projects to choose from:
- Report Server Project Wizard. Creates a report project and solution and immediately opens the Report Wizard, which will walk you through steps of creating a basic report.
- Report Model Project. Creates a report model project to allow you to create a semantic layer to be used by business users.
- Report Server Project. Creates a report project and solution with no objects created. This is the option that we will use to get exactly the desired layout.
Now that we’ve selected the report server project, we need to create a report to design. In the Solution Explorer, shown in Figure 5, right click on the Reports folder and select Add > New Item.
| Note: Selecting the Add New Report option will open the Wizard mentioned in the Report Server Project Wizard. This is a great option if you are learning about SSRS and would like to see some of the different options available to you! |
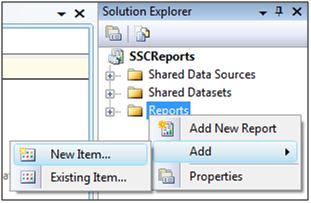
Figure 5. Solution Explorer
Once the Add New Item window opens, select the Report template. Enter a meaningful name in the Name field, as shown in Figure 6, and select the Add button. Now that we’ve set up the report, we can look at different designer panes in the design environment.
 Figure 6. Add New Item Window
Design Environment
Toolbox
The toolbox contains the display items that we want to show in our report. Some of these items include table, matrix, image, and graph. See all items available in the toolbox in Figure 7.
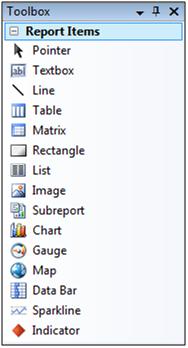
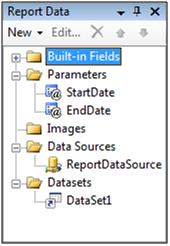
Figure 7. Toolbox
Report Data
The Report Data pane provides access to everything you would want to put into a report, including global variables, data from your dataset, parameter values that a user entered, and images. These are the data points used to fill in the display items from the toolbox. See all of these options in Figure 8.
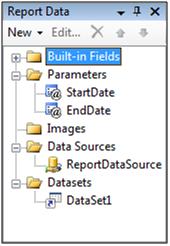
Figure 8. Report Data Pane
Design Tab
The Design tab contains the design surface where you will lay out your report. You will place display items and data points from the toolbox and report data pane, respectively, to design the report. The Design tab is shown in Figure 9.
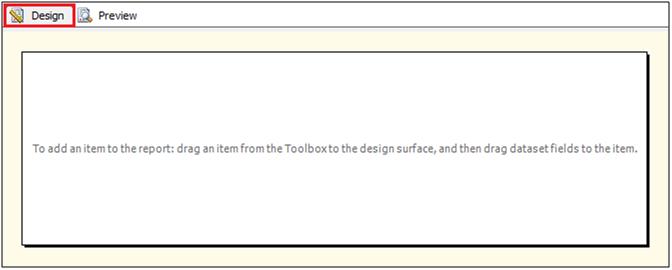
Figure 9. Design Tab
Preview Tab
The Preview tab will display the report with data as you have set it up in on the Design tab. The tab highlighted is shown in Figure 10.

Figure 10. Preview Tab
Properties Pane
Finally, the Properties pane shows all of the attributes that you can modify. As you select different report items, the properties will change. Some properties’ values can be selected from a dropdown list, and some need to be filled in free-form. The Properties pane for the Report item can be seen in Figure 11.
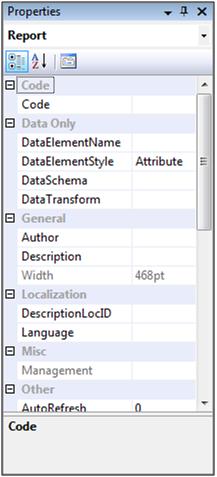
Figure 11. Properties Pane
The Third Option
Now that we’ve seen how Report Builder and BIDS work, we would be remiss in our description if we did not mention a third option for creating reports, which is to use a non-Microsoft program. Any reports created by another program that uses the RDL specification can be deployed to the Reporting Services report server. The RDL specification is publicly available and can be found at: http://msdn.microsoft.com/en-us/library/dd297486.aspx.
Ready to get down to business
At this point, we’ve seen the development environments that are available, and we understand what all of the windows and panes will do for us. We know how to create an empty shell for a report, and we are ready to get down to business. The next step is to connect to a data source and pull some data out.
Your report for Big Boss could have several data stores, so we need to learn all about the options of pulling data into a report, the different methods for data retrieval, and how to use that data once it’s available to us. You will learn all of that in the next SSRS in a Flash article, Data Everywhere.


