The slicing and dicing of data originates from dimension table columns. The tabular model labels all fact and dimension imports as a table. The distinction between dimensions versus facts are non-existent in Tabular Models. Cleaning up the attributes of dimensions in these tables helps organize the available slicers and dicers. This leads to better adoption by users. These additional configurations include renaming a table/column, hiding a table/column, removing columns, setting display folders and concatenating columns into a computed column.
There are some cases of a slicer or dicer coming from a fact table. Sometimes there is a trend to offer all attributes in one table or view. There 2 main problems with this path. It is confusing to the end user because of the de-normalization some reporting systems provide. This might overwhelm users with the amount of options and to see the model as too complicated to use on a daily basis. The other problem shows its ugly head when the source of data gets larger and larger, hurting the processing of the model. The DAX queries start to slow down and performance tuning is needed. A good star schema is still the best practice today.
Customer Dimension
Figure 1 shows the raw table for a customer in the original model developed so far in articles 3 and 4. Here, there are too many columns and no organization.
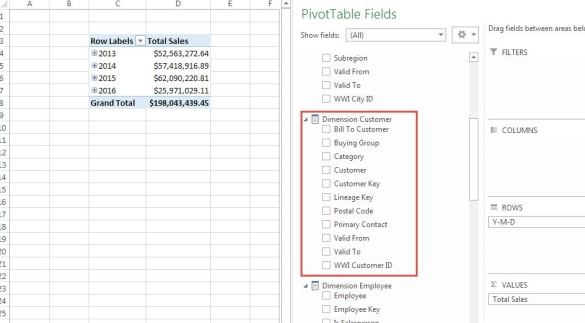
Figure 1 Viewing in Excel - Dimension Customer
The first apparent change is the table name. This should be renamed from Dimension Customer to Customer. To rename the table, right click the Dimension Customer tab in the Grid view, or edit the Table Name in the properties like in Figure 2.

Figure 2 Rename the Dimension Custom table
The second item is dealing with columns that are not required for reporting: Customer Key, Valid From, Valid To and WWI Customer ID.
The reporting user has indicated that attributes needed are Buying Group, Category, Customer and Postal Code. Others like WWI Customer ID might be hidden in order to plan for future requirements or to be used in calculated columns. The Customer Key is needed for relationships to fact tables so it has to be hidden.
The overwhelming influence for removing a column is performance. Every column used in a table in a Tabular Model is stored in memory. So, removing the Valid From and Valid To columns from the query to import data in the model would be wise. Every row imported would not include these values. Hidden columns are still stored in memory and are imported into the model. Instead of hiding or deleting the columns, you can control the import. To start, go to the table definition shown in Figure 3 in the Grid view.
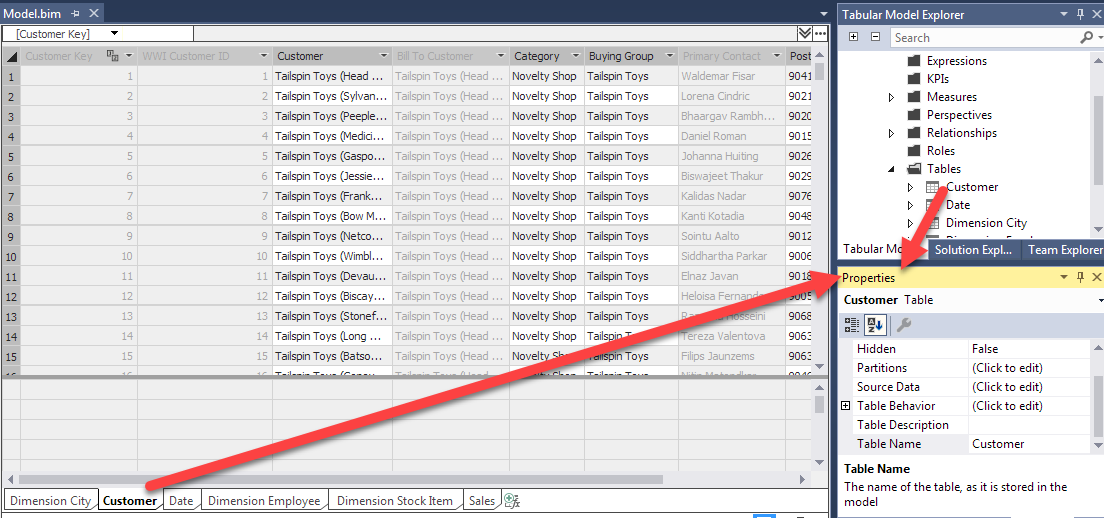
Figure 3 Properties of Customer Table
In the properties, select the ellipse in the Source Data property. The Design… button launches the M interface shown in Figure 4.
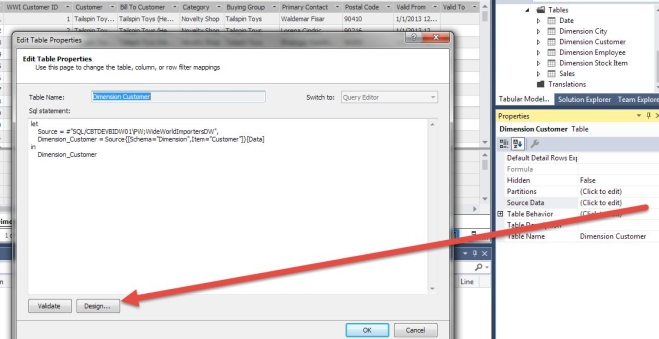
Figure 4 M Code
The Design… button opens the Power Query Editor and gives options for mashing up data. The main objective in this article is to remove unneeded columns. This is done by right-clicking on the column and selecting Remove Column from popup menu. Figure 5 shows the Power Query Editor.

Figure 5 Power Query Editor
Notice the Applied Steps to the far right. This is one of the best features in this editor. Each change made in the edit session will be recorded. The user can back track what was executed. It is kind of like Ctrl+Z (undo) and Ctrl+Y (redo) on steroids. There is a settings icon to the right of some steps which show the details of the step. This could be like a step to remove the top 2 rows. The settings would let someone change it to removing 3 rows.
After using the Control key and clicking on Valid From, Valid To and Lineage Key to multi select columns, the right click menu gives the option to Remove Columns like Figure 6. There is also the menu option to Remove Other Columns which lets the user select the columns to keep and removing the other columns not selected. The Add Column From Examples is an intelligence option to create a new column and learn from data in the table.

Figure 6 Remove 3 Columns From Dimension Customer
The next step is to click the Import button (Figure 7) in the top left to save changes and refresh the data in the model.
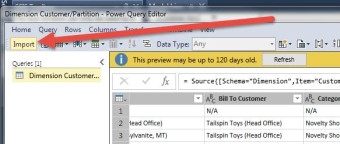
Figure 7 Import changes
Figure 8 shows the M code for removing columns. The graphical interface is much easier to use than learning the M code but this is one method to understand the M Code generated.

Figure 8 M Code To Remove Columns
Once back in the Grid view, right click the columns to Hide from Client Tools. Figure 9 shows an example of hiding a column. This model will hide Customer Key, WWI Customer ID, Bill To Customer and Primary Contact hidden from client tools
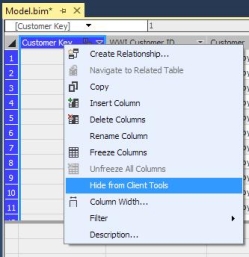
Figure 9 Hide from Client Tools
The last item is to create a Hierarchy with the Buying Group and Category columns. This would be considered a user hierarchy. The other type is a natural hierarchy like was created in the previous article with Year, Quarter, Month and Day. The grid view is the easiest place to create this hierarchy. Figure 10 shows the icon for Grid View.
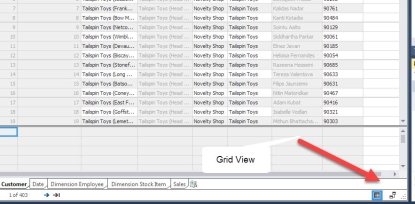
Figure 10 Grid View
To create a hierarchy, right click on a column (Figure 11) and select Create Hierarchy.
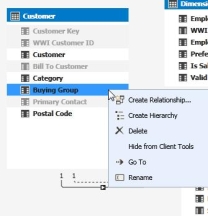
Figure 11 Create Customer Hierarchy
Rename the hierarchy to Customer Grouping and right-click on Category (Figure 12) to add to this hierarchy.
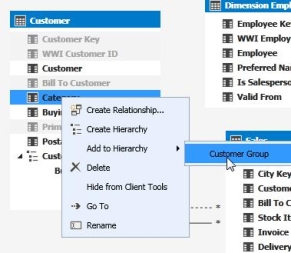
Figure 12 Add Columns to Hierarchy
Figure 13 shows the display in Excel after these changes. This is so much better for users while reporting.

Figure 13 Updated Customer Dimension in Excel
City Dimension
For the City Dimension, the following needs to be done. Figure 14 shows the results in the Grid View.
Rename the table to City
Remove columns Valid From, Valid To and Lineage Key
Create 2 Hierarchies
Regions with Region, Subregion, and Sales Territory
Geography with Continent, Country, State Province, and City
Hide Columns
City Key, WWI City ID, Sales Territory, Region, Subregion and Location
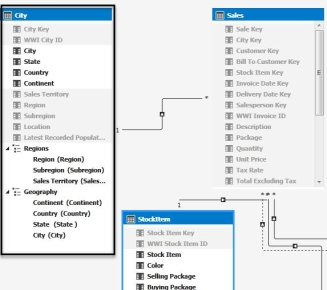
Figure 14 City Dimension Table
Employee Dimension
The Employee Dimension table needs the following updates and should look like Figure 15.
Rename table to Employee
Remove columns Valid From, Valid To and Lineage Key
Hide Employee Key and WWI Employee Id

Figure 15 Employee Dimension Table
Stock Item Dimension
Stock Item Dimension needs the following updates. A new feature used in this dimension is Display Folder. The Display Folder property helps organize columns for display and selection in reporting tools like PowerBI and Excel.
Rename table to Stock Item
Hide all columns except Stock Item, Color, Selling Package, Buying Package, Brand and Size
Change the Display Folder for Selling Package and Buying Package to Packages like Figure 16

Figure 16 Display Folder for 2 Columns
Summary
Once a Tabular Model is initially created, cleaning up the dimension attributes assist in adoption of the model. Users want as little complexity as possible. Making it simple with Display Folders and Hierarchies are the main organization options in a Tabular Model. Remembering the difference between removing or hiding a column helps with performance and cleanup. Even if a column is removed or hidden, there are options to add back to the model later if needed.

