Introduction
The case always comes up when there is more than one date key in a fact table. Analysis Services tabular model only allows one active relationship between a fact table and another table like the date dimension. A DAX measure using a Date dimension column will be in the context of the active relationship. The other relationship(s) with the date dimension can be present but are inactive. The Data dimension is called a role-playing dimension based on dimensional modeling concepts.
There is also the case when the relationship between one fact table is based on a different date column from a different fact table. For instance, the date in Sales is on order date while the relationship to the Transaction table is based on transaction date. If the Date dimension is named Date, then a user might get confusing on why the Date table is related to two different descriptive dates in the model. This has to be explained in documentation and training.
Role-Playing Dimension
Even though dimensional modeling is considered a de-normalization of a database, the role-playing dimension tries to bring a non-repeating pattern back into the mix. Figure 1 shows the Date table and two relationships with the Sales table plus a relationship with a different fact – Transaction Date. The Date is considered Conformed between two facts – Sales and Transaction and within the Sales by the two relationships – Invoice Date Key and Delivery Date Key.
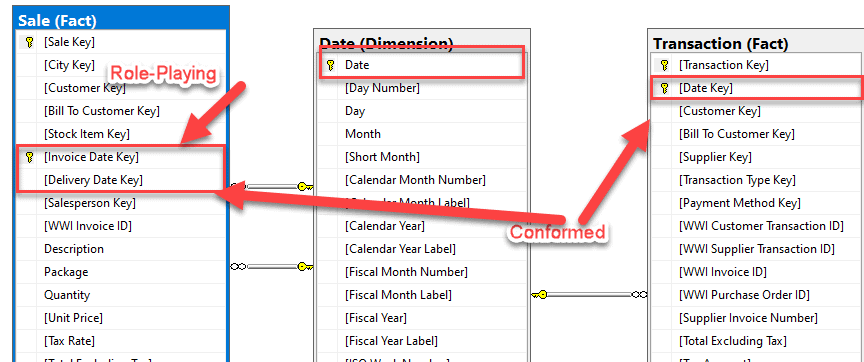
Figure 1 Role-Playing Dimension
The Invoice Date Key and Delivery Date Key from the Sales table are both related to the Date dimension table. During the import of these tables into the model, the database foreign keys created the initial relationships. The Invoice Date Key became the active relationship by coincidence but it is the active relationship for this model. The Tabular Model will only recognize one relationship as active. So, when we create a Time Intelligence measure (Sales YTD), the active date (Invoice Date Key) relationship will be used to evaluate the measure. Figure 2 shows the Edit Relationship screen for Invoice Date Key.

Figure 2 Active Relationship on Invoice Date Key
When a measure like Sales YTD (Sales Year to Date) is created, the active relationship on Invoice Date Key will be used like in Figure 3. Note that Sales Year to Date was created in Level 6 of the series.
Sales YTD:= CALCULATE([Total Sales],DATESYTD('Date'[Date]))

Figure 3 Sales YTD
If a Sales YTD for Delivery Date is needed, the relationship has to be defined in the measure. Figure 4 shows this syntax for the new Delivery Sales measure. The DAX language has a USERRELATIONSHIP function to change the context of the Date dimension in the measure. Here, the active relationship is Sales[Delivery Date Key] instead of Invoice Date Key for the measure Delivery Sales. Delivery Sales is the equivalent as Total Sales for Invoice Date Key.
Delivery Sales:=
CALCULATE (
SUM(Sales[Total Including Tax]),
USERELATIONSHIP( Sale[Delivery Date Key], 'Date'[Date])
)
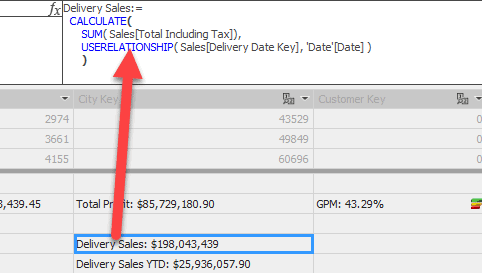
Figure 4 Delivery Sales With Delivery Date Key
Figure 5 shows the Delivery Sales YTD measure. The measure has a description in the title to differentiate the Sales by Invoice Date Key to Delivery Date Key. One would also be inclined to change the description of Total Sales to Invoices Sales.
Delivery Sales YTD:=
CALCULATE(
[Delivery Sales],
DATESYTD('Date'[Date])
)
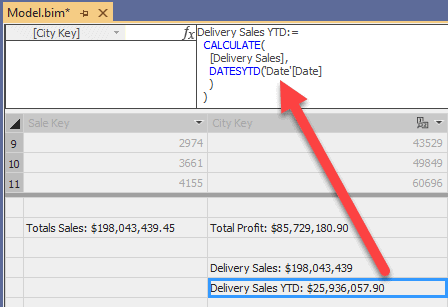
Figure 5 Delivery Sales YTD.
These 2 can now be side by side in a report like Figure 6. This is very powerful and shows the abilities of using Analysis Services to provide the business with an analytical database.
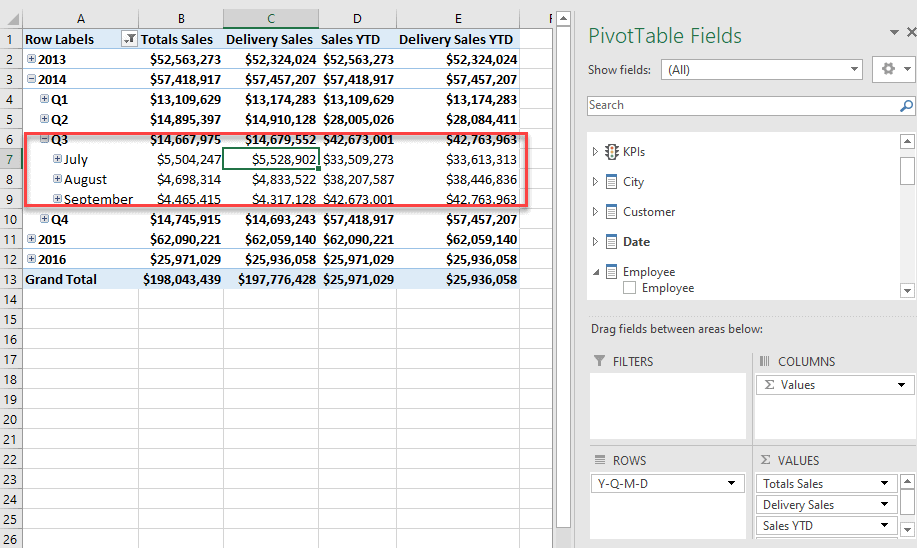
Figure 6 Delivery and Total Sales Report
More Than One Date Dimension
Another option would be to have two different Date dimension tables in the model like Figure 7. The problem that occurs most with this option is maintaining two or more date dimensions. It can be further complicated when someone starts creating a new Date dimension for each date in all facts. This can be sustained, but good documentation is probably needed for people that inherit the development and support of this model.
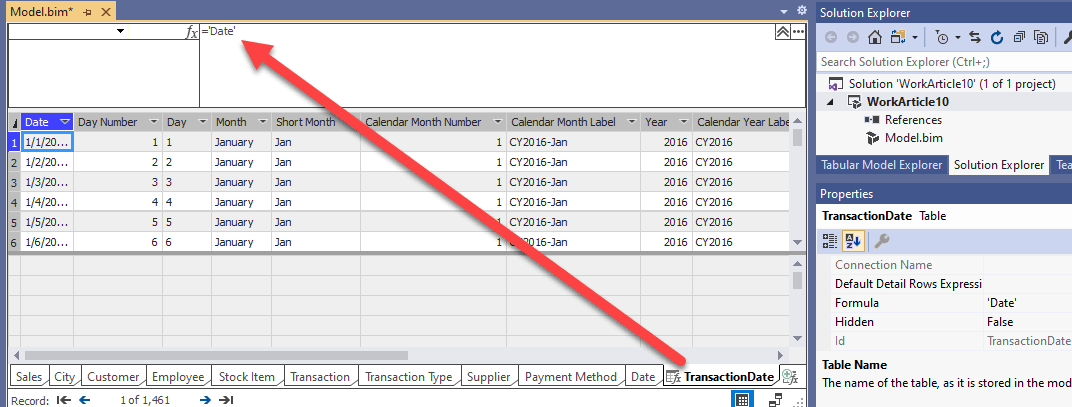
Figure 7 Transaction Date from CALCULATEDTABLE
The example in Figure 7 uses the DAX function CALCULATETABLE. The design on the Date dimension is calculated (copied) into the new table – Transaction Date. This copy of an existing table is easy except now the relationship has to be added. Figure 8 shows the new model. The naming convention is nice to differentiate the two dimensions.
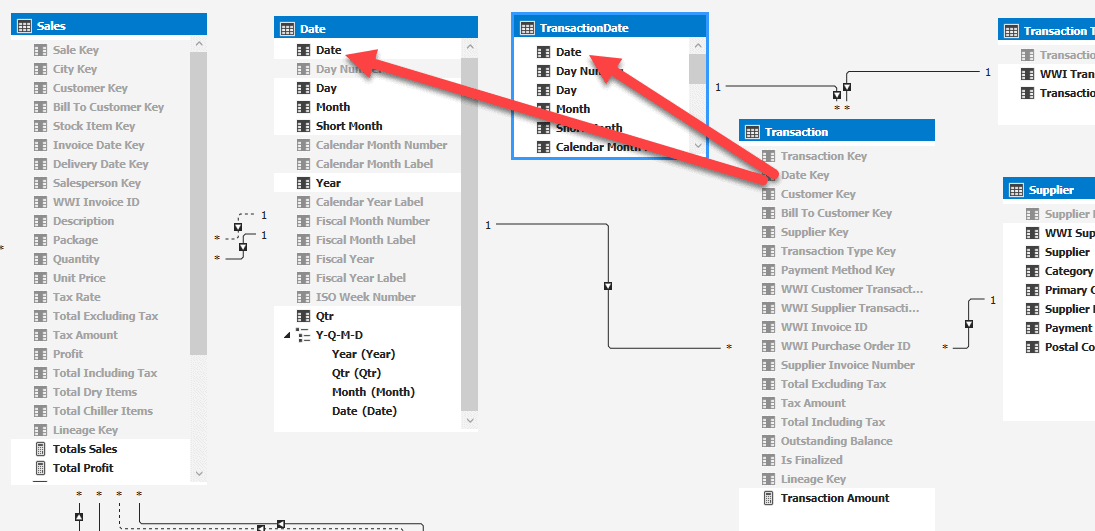
Figure 8 New Transaction Date Relationship
NOTE: A new import of the DimDate table can be used to create a new Date dimension. CALCULATEDTABLE is not required.
The issue now is trying to place both a measure from Sales side by side with Transaction measures in a report plus have the right Date dimension attributes displayed in the report. The best option for this would be a scenario where the end user would never want Sales measures conformed to Transaction measures. It is possible but not common.
Next, a new Date can be copied from Date and renamed Delivery Date as in Figure 9.
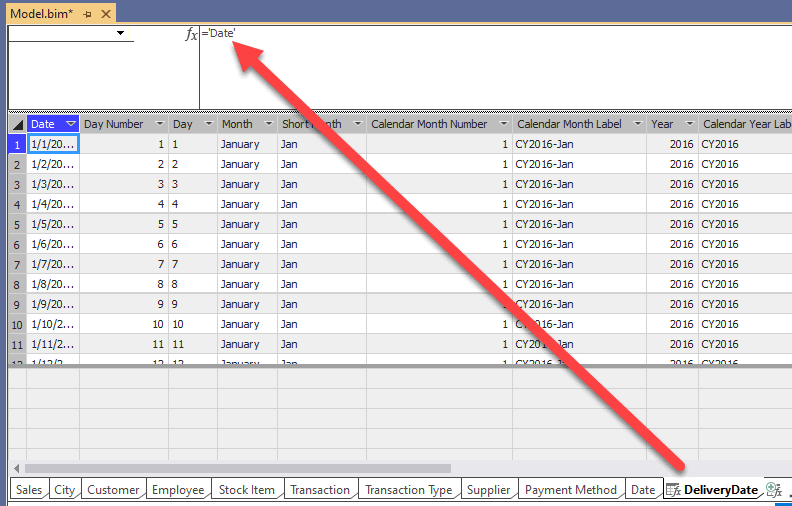
Figure 9 Delivery Date
After this addition, the relationship would need to be removed from Date and added to Delivery Date (Figure 10).
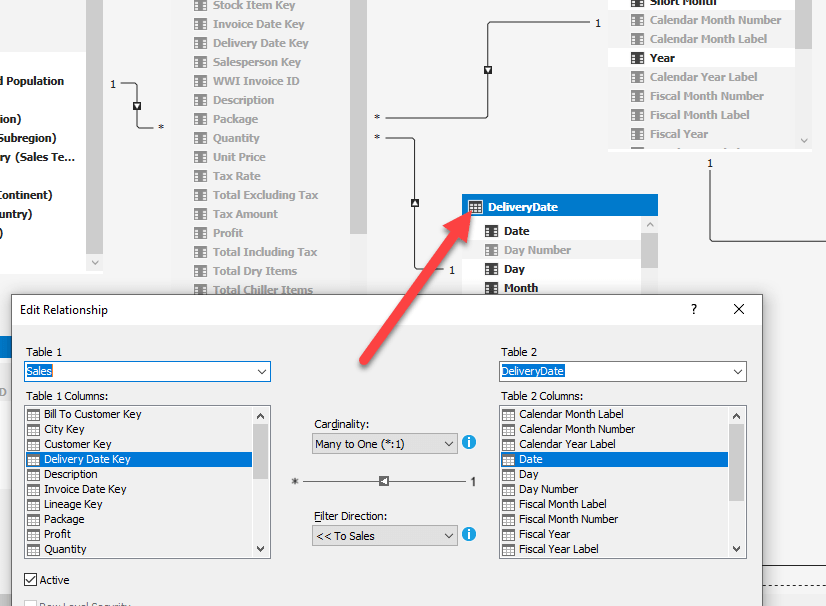
Figure 10 Delivery Date relationship
The measure Delivery Sales would have to be updated to remove the USERRELATIONSHIP function and just be a SUM. Figure 11 shows the measure Delivery Sales YTD updated with the Delivery Date table relationship.
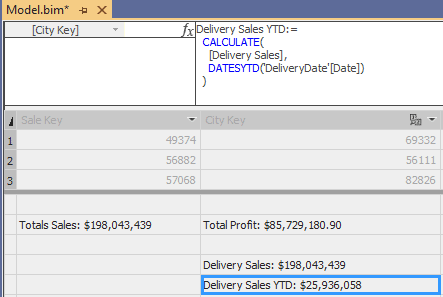
Figure 11 Delivery Sales YTD
Summary
The Date dimension in a dimensional model greatly assists in an analytical database. The measures using DAX provides Time Intelligence features that makes Analysis Service a go to tool for single source of truth. This article shows some scenarios that crop up in most analysis. The USERRELATIONSHIP DAX function assists with measures not related to the active relationship for the Date table. The CALCULATETABLE can help duplicate a Date table for additional relationships, but it should be used with caution.

