Introduction
In Level 1 of this series, I discussed Synapse Analytics basics and the steps for creation of the Synapse Workspace. In Level 2, data analysis was done on Data Lake files using Serverless SQL Pool. In Level 3, I will analyze data from the files uploaded in Data Lake container using a Spark Pool. I will show the steps to create external tables as well.
Apache Spark is an open source distributed parallel processing framework for large-scale data processing and analytics. Apache Spark applications run as independent sets of processes on a cluster. The run is coordinated by the SparkContext object in the main program (also known as driver program). The SparkContext connects cluster manager and acquires executors on nodes in the cluster to run the application code. The SparkContext collects the results of the operations from executors and then return the final result through the Driver program. In Azure Synapse Analytics, a cluster is implemented as a spark pool.
Spark is used in two kinds of workloads:
- ingest, clean and transform batch and stream data
- explore, analyze and visualize data
Data Analysis Steps
I will explain the steps to use the Spark Pool to query data from the files uploaded in the Data Lake Storage account. Also, I will create an external table under the Spark Pool.
Create a new Spark pool
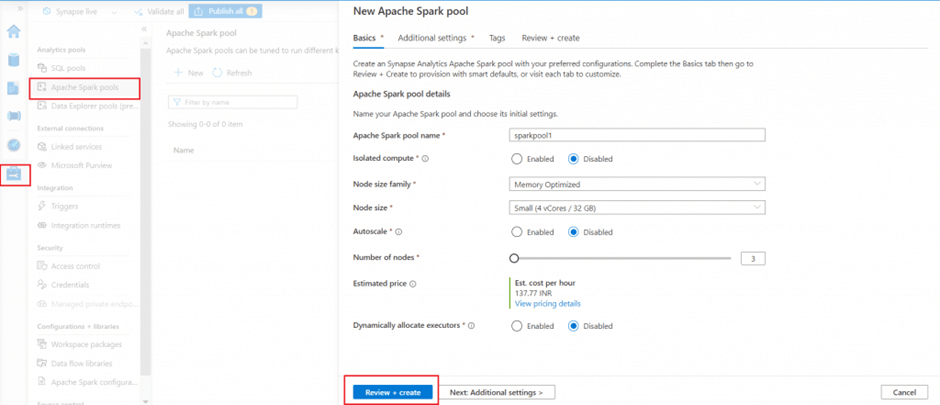
Before using the Spark pool for data analysis, I need to create it using Synapse Studio. I go to Manage tab and Apache Spark pool menu item to create a new pool. I provide a name for pool and node size. I keep Autoscale option disabled for now. If autoscale is enabled, a range of nodes can be mentioned to be used as per the workload. Here, I selected 3 number of nodes (the minimum allowed). Based on the number of nodes and node family selected, cost is estimated and shown in the estimated price column.
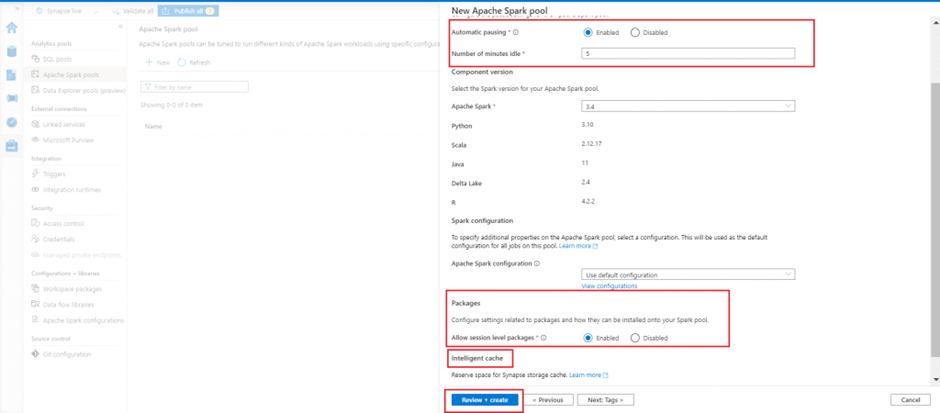
I go to the Additional Settings tab. I enable the automatic pausing option and set the number of idle minutes value as 5. This will ensure the pool will be paused after 5 minutes being idle. This option will help to save cost when the pool is not in use.
The Intelligent Cache caches data to help speed up the execution of Spark as it reads from ADLS Gen2 data lake. It can automatically detect changes to the underlying files and refresh accordingly. This feature improves performance on subsequent reads of the files stored in the available cache.
I keep the Allow session level packages option as enabled. This option helps to specify session-scoped libraries at the beginning of a notebook session in addition to pool level packages.
I select the Apache Spark version as 3.4 (the latest version available in the drop down).
I press the Review+ create button to create the Spark pool.
Create a spark notebook and add a comment
A notebook is a web interface to create files that contain live code, visualizations, and narrative text. A small code block can be written in a cell and executed independently to see the immediate result.
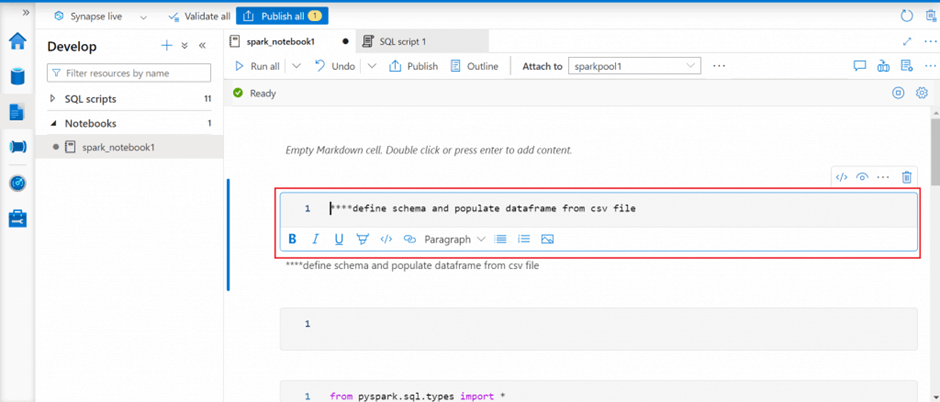
Using the Develop menu, we can create a new notebook in Synapse Studio. I attach the notebook to the Spark pool created in the previous step. The notebook should be attached to a Spark pool before executing any code written in the notebook.
The cells in the notebook can be of two types -- code cell and markdown cell. Markdown cell is used for documentation of the code. Different formatting can be chosen for text used for cell documentation. I add a markdown cell and write a statement.
Write a query to retrieve data from csv file
A Synapse notebook supports the following languages:
- PySpark (Python)
- Spark (Scala)
- Spark SQL
- .NET Spark (C#)
- SparkR (R)
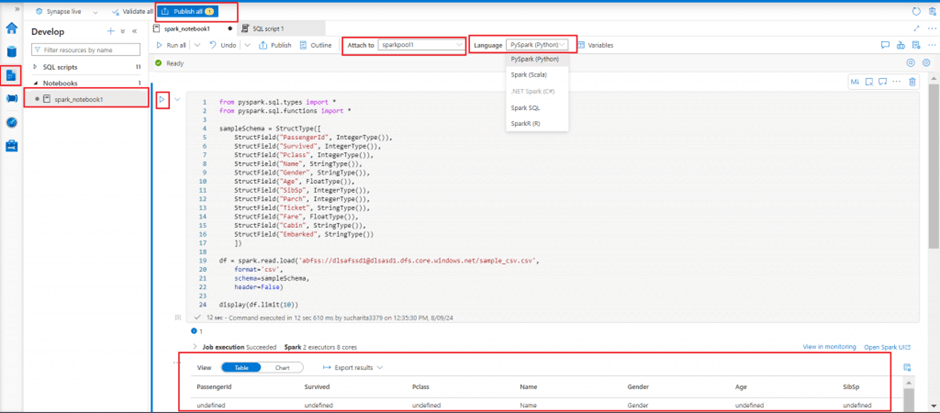
The primary language for the newly added cells can be selected from the language menu at the top of the notebook. I am using pyspark as the language for my notebook. In the notebooks, a SparkSession instance is automatically created and stored in a variable called spark. There's also a variable called sc for SparkContext.
I add a code cell and write pyspark code to first define a schema based on the data available in a csv file stored in the primary data lake account. I then define a dataframe named df to read and populate data from the csv file. In the final statement, first 10 records of the dataframe is displayed.
I press the run button in the left side of the cell to execute the code. First 10 records are displayed in the output window.
The code to read the CSV is shown here.
from pyspark.sql.types import *
from pyspark.sql.functions import *
sampleSchema = StructType([
StructField("PassengerId", IntegerType()),
StructField("Survived", IntegerType()),
StructField("Pclass", IntegerType()),
StructField("Name", StringType()),
StructField("Gender", StringType()),
StructField("Age", FloatType()),
StructField("SibSp", IntegerType()),
StructField("Parch", IntegerType()),
StructField("Ticket", StringType()),
StructField("Fare", FloatType()),
StructField("Cabin", StringType()),
StructField("Embarked", StringType())
])
df = spark.read.load('abfss://dlsafssd1@dlsasd1.dfs.core.windows.net/sample_csv.csv',
format='csv',
schema=sampleSchema,
header=False)
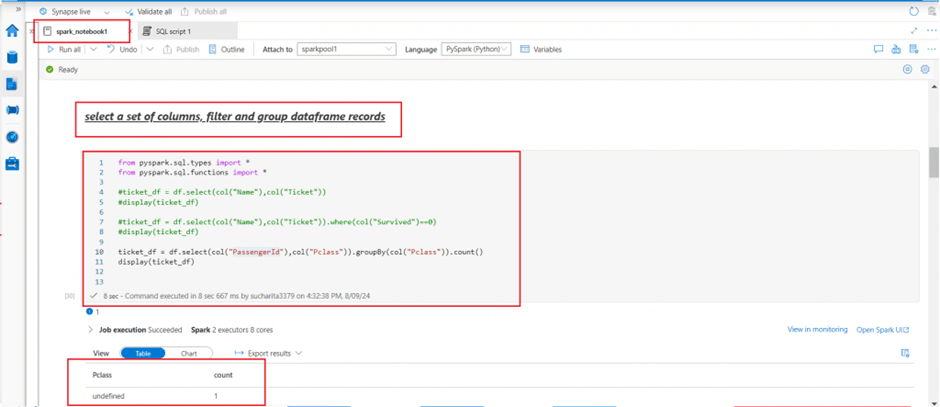
display(df.limit(10))Select columns, filter, and group data in a dataframe
I add a new code cell. I write pyspark code to select two columns from the df dataframe and save in a new dataframe named ticket_df. In the next statement, I select the two columns and filter the rows based on a condition using where clause. In the third statement, the ticket_df dataframe is populated with the count of passangers in each class using the group by clause and count function.
from pyspark.sql.types import *
from pyspark.sql.functions import *


#ticket_df = df.select(col("Name"),col("Ticket"))
#display(ticket_df)


#ticket_df = df.select(col("Name"),col("Ticket")).where(col("Survived")==0)
#display(ticket_df)


ticket_df = df.select(col("PassengerId"),col("Pclass")).groupBy(col("Pclass")).count()
display(ticket_df)
Using a SQL query in a spark notebook
The Dataframe API is part of a Spark library named Spark SQL It enables use of SQL expressions to query and manipulate data. The Spark catalog is a metastore for relational data objects such as views and tables. A temporary view is the simplest solution to make data in a dataframe available for querying in the Spark catalog. A view will be automatically after the current session expires. Tables can be created for persistent storage in the catalog.
I create a view named shipdata from the dataframe. Then I use the spark.sql module to write SQL select statement to retrieve data from the view and populate in another dataframe. In the next cell, I write the SQL select statement directly without spark.sql module. I use the magic command %%sql to change the language of the cell from pyspark to Spark SQL.
Multiple languages can be used in one notebook by specifying the correct language magic command at the beginning of a cell. The magic commands for the different languages are:
- %%pyspark --> Python
- %%spark --> Scala
- %%sql --> Spark SQL
- %%csharp --> .NET for Spark C#
- %%sparkr --> R
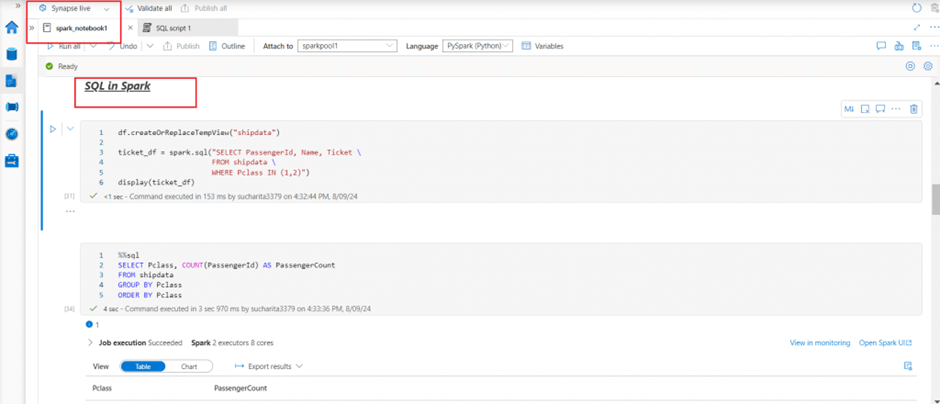
Here is the code that will run a SQL query.
## SQL in spark


df.createOrReplaceTempView("shipdata")


ticket_df = spark.sql("SELECT PassengerId, Name, Ticket FROM shipdata WHERE Pclass IN (1,2)")
display(ticket_df)


%%sql
SELECT Pclass, COUNT(PassengerId) AS PassengerCount
FROM shipdata
GROUP BY Pclass
ORDER BY Pclass
Data visualization in notebook output
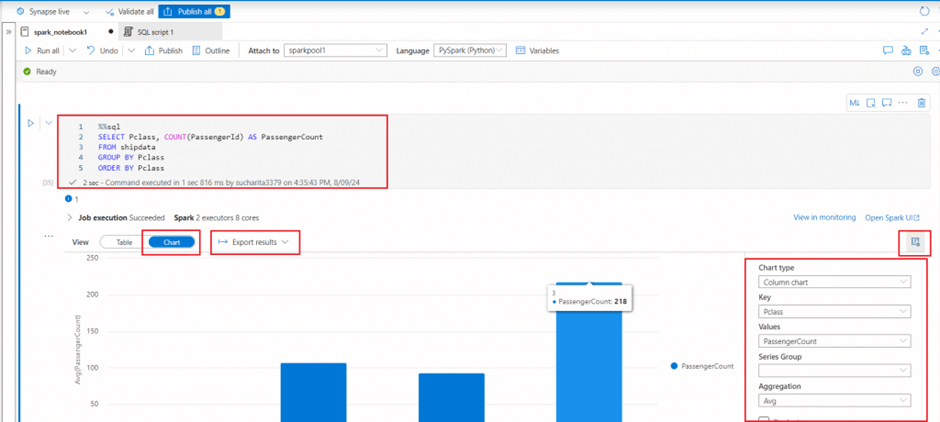
Notebooks provide some basic charting capabilities for data visualization in the output window. The view needs to be changed from Table to Chart in the output window. Different chart types and other field values can be selected to visualize data in the needed way. Python graphics libraries can also be used to create and display data visualizations in the notebook.
I select the Chart view in the output window for the select query on shipdata. A column chart is selected for visualization.
Data transformations in a dataframe
Apache Spark provides a powerful platform for performing data cleansing and transformation tasks on large volumes of data. Data loading can be done from Data Lake files and complex data modifications can be done using Spark dataframe object. The transformed data can be saved to the Data Lake for downstream processing or ingestion into a data warehouse.
I continue working on the dataframe named df containing data from the Data Lake csv file. I implemented the following data transformation operations:
- creating new column from existing columns using the withcolumn and split functions
- remove column using the drop function
- delete all NULL records using the dropna function
- partition data by a column and write in parquet file using the partitionBy function
Partitioning is an optimization technique that enables Spark to maximize performance across the worker nodes. Data in a dataframe needs to be saved as a partitioned set of files using partitionBy method. Data can be partitioned by multiple columns, which results in a hierarchy of folders for each partitioning key.
When reading back data from parquet files into a dataframe, data can be pulled from any folder within the hierarchical partitioned folders. The filtering is done with the use of explicit values and wildcards against the partitioned fields. The partitioning column specified in the file path in read method are not included in the resulting dataframe.
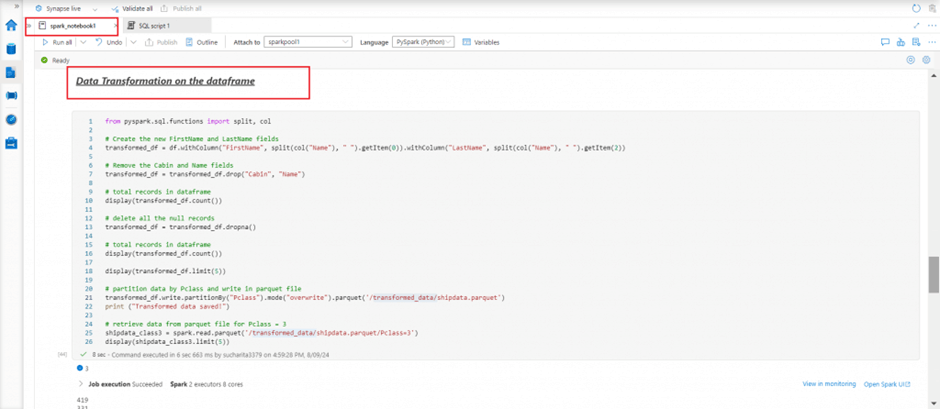
from pyspark.sql.functions import split, col


# Create the new FirstName and LastName fields
transformed_df = df.withColumn("FirstName", split(col("Name"), " ").getItem(0)).withColumn("LastName", split(col("Name"), " ").getItem(2))


# Remove the Cabin and Name fields
transformed_df = transformed_df.drop("Cabin", "Name")


# total records in dataframe
display(transformed_df.count())


# delete all the null records
transformed_df = transformed_df.dropna()


# total records in dataframe
display(transformed_df.count())
display(transformed_df.limit(5))


# partition data by Pclass and write in parquet file
transformed_df.write.partitionBy("Pclass").mode("overwrite").parquet('/transformed_data/shipdata.parquet')
print ("Transformed data saved!")


# retrieve data from parquet file for Pclass = 3
shipdata_class3 = spark.read.parquet('/transformed_data/shipdata.parquet/Pclass=3')
display(shipdata_class3.limit(5))
Data partitions in the Storage account folder
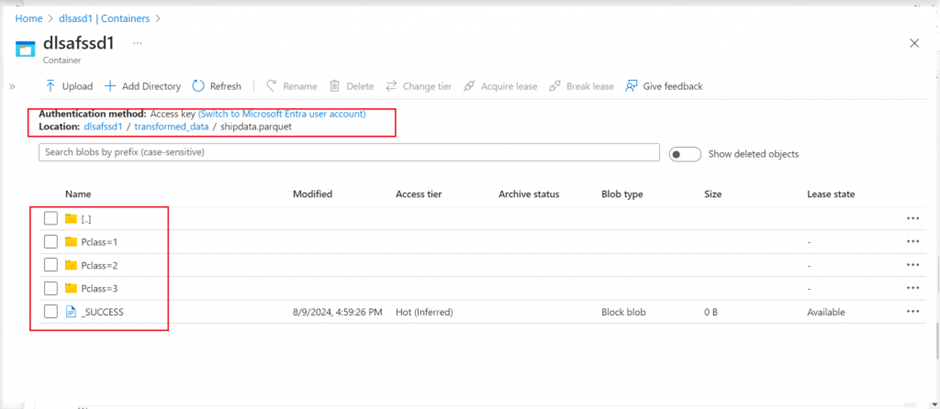
I go to the primary container of the Data Lake account linked with my Synapse workspace. Folder structure as mentioned in the write method is available. For each value of the partitioned key, a separate folder is created. Once I browse through the folders, I can see the parquet file saved for data .
Create and use tables
Two types of tables can be created in Spark catalog -- managed tables and external tables
- managed tables: both metadata and data are stored in the Catalog. Once the table is deleted, metadata and data are removed from catalog. An empty table can be created by using the spark.catalog.createTable method. A dataframe can be saved as a table by using its saveAsTable method.
- external tables: metadata is stored in the Catalog. But, data is referred from external storage location. Deleting an external table does not delete the underlying data. An external table can be created by using the spark.catalog.createExternalTable method. A dataframe can be saved as a table by using its saveAsTable method and mentioning the external path to keep the data files.
I create an external table from the dataframe populated in previous step and mentioning a relative path for the data files of the table. In the next cell, I write a SQL query to retrieve data from the table.
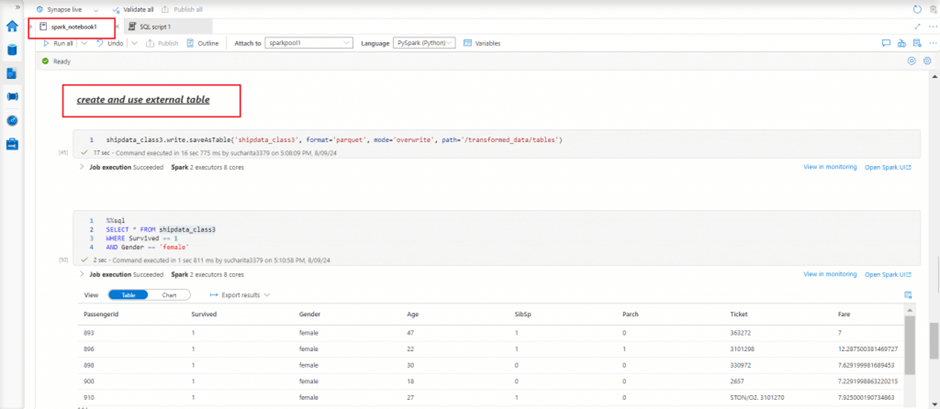
## create and use external table


shipdata_class3.write.saveAsTable('shipdata_class3', format='parquet', mode='overwrite', path='/transformed_data/tables')


%%sql
SELECT * FROM shipdata_class3
WHERE Survived == 1
AND Gender == 'female'
External table files in the storage account folder
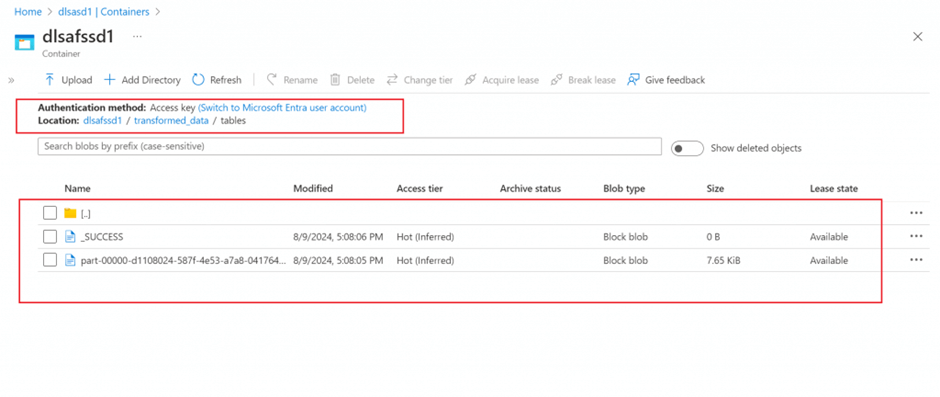
I go to the primary container of the Data Lake account linked with my Synapse workspace. Folder structure as mentioned in the path argument of saveAsTable method is available. Once I browse through the folders, I can see the parquet file saved for the external table.
I drop the table using Drop Table command. But, the data file is still available in Data Lake as the table was an external table.
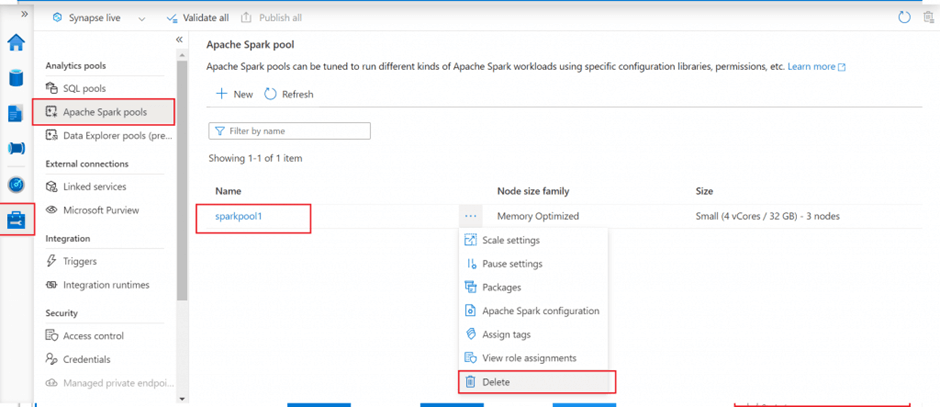
Delete the Spark Pool
After execution of the notebook completes, I go to the Manage tab. I select Apache Spark pool created in the first step and delete it. The Spark pool will not be available to be connected anymore. If there is any query, pipeline, or notebook that use the Spark pool will also stop working.
Conclusion
An Apache Spark pool in Synapse Analytics provides open-source big data compute capabilities. Spark pool is used for Data Engineering, Data preparation, Machine Learning implementation, and Streaming data processing. The Spark pool needs to be created first to load, model, process, and distribute data for faster analytic insight. Spark in Azure Synapse Analytics can be used to work with data from various sources including a data lake based on the primary storage account and defined as linked service, dedicated or serverless SQL pool, Azure SQL or SQL Server instance, and Cosmos DB, Azure Data Explorer Kusto database, external Hive metastore defined as linked service.
