As you walk into work, there's a skip in your step and a smile on your face. You march up to your desk ready to start the day and tackle the world's problems. Turning on your computer, you notice a blue sticky note peeking out from underneath a pile of papers.
Four bold words jump off the page: Pretty Header Logo Title
Uh oh! These were the notes you created to wrap up your latest report. You’ll need to use the Stairway to Reporting Services series to create a header that contains the listed items. This article will show you how to create these “extra” items, such as headers and footers, textboxes, and other layout options, to increase the readability and manageability of your reports.
To set up the rest of your report, be sure to read the full series here: Stairway to SQL Server Reporting Services.
What do we mean by “Extra”?
While the "extra" items in the toolbox may not seem as exciting as the items we've already covered, these items really make the report bearable to the end user. These items allow us to add titles, to create visible/visual report sections, and customize a report so that is specific to your organization. Not only do some of these items allow you to modify the report design, they also allow you to use data or runtime information.
The items included in this group are:
- Header and Footer
- Textbox
- Line
- Rectangle
- Image
- Parameter
By using the additional items in the toolbox, we will end up with a report that looks like Figure 1.
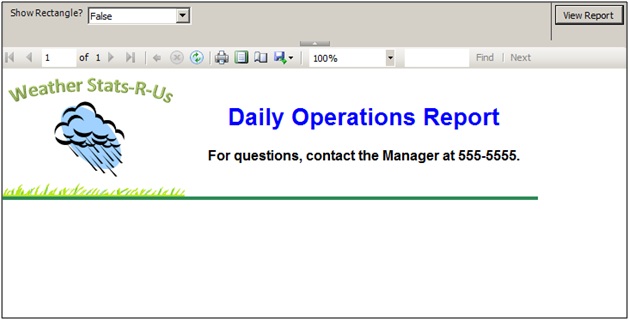
Figure 1. Final report showing Extra report items
Header and Footer
Headers and footers split the report into different sections to allow for the grouping of data that you want to show on every page. As it sounds, a header is at the top of the page, while the footer is at the bottom of the page. These are great items to use if you need to add a title or the date and number of pages to your report. Keep in mind that you can’t list rows from the dataset in your header or footer, as they have not been accessed at that rendering point. Turning on the header and footer is very simple.
In the Business Intelligence Development Studio (BIDS), right-click on the beige part of the Design tab. As shown in Figure 2, there are two options: Add Page Header and Add Page Footer. Clicking each of these options will add separate areas to the report area that are shown with descriptions of their purpose, as shown in Figure 3.
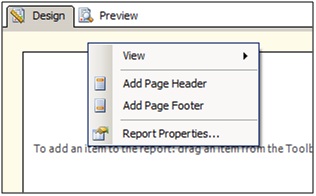
Figure 2. Option to Add a Page Header or Page Footer
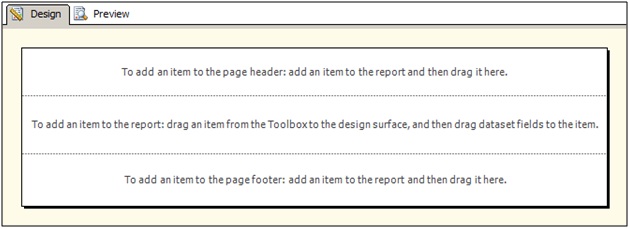
Figure 3. A blank report with a Page Header and Page Footer
We will focus on the header in the following examples to show how it works, but note that anything we design on the header can also be designed on the footer.
Textbox
Next, we move onto the textbox, which provides the report writer with the ability to put text anywhere they want in the report. Starting in SSRS 2008, the textbox allows you to use different text, fonts, and colors within the same item. Essentially, you can think of your textbox just like a Word document, where you can have multiple formats within the same area. Let's use a textbox to create a title in the Header of our report.
Begin by adding the Textbox item to the report header. Right-clicking on the box and selecting Text Box Properties... will allow us to start setting up our properties. The Value field is where you can put the text that you would like displayed, such as "Daily Operations Report". This view can be seen in Figure 4. You can make additional changes in the Properties window, or you can select OK to make the changes through the BIDS toolbars. Let's do that.
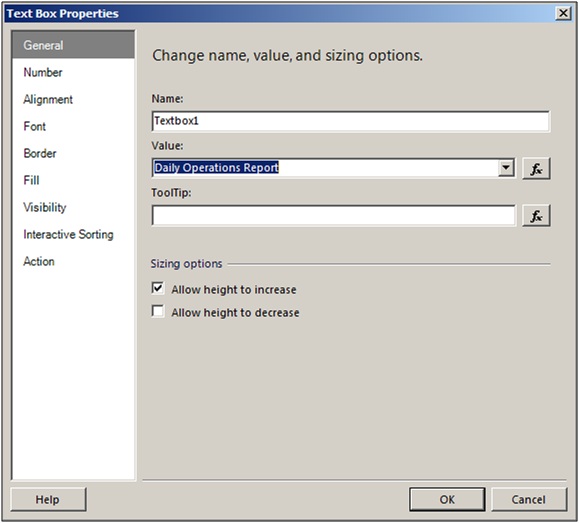
Figure 4. Text Box Properties screen for Title
Once we are back to the Design tab, increase the size of the textbox to see the entire phrase. With the textbox selected, go to the Properties window in BIDS.
| Note: If you don't see the Properties window press the F4 key or go to View > Properties Window. |
Set the following properties with the values that are listed:
| Property Name | Property Value |
| Color | Blue |
| Font > FontSize | 20pt |
| Font > FontWeight | Bold |
| TextAlign | Center |
| VerticalAlign | Middle |
If you select just a portion of text, you can make similar changes that only affect that section. For example, add the following text after your initial phrase: "For questions, contact the Manager at 555-5555.". By selecting the new text, you can change the font size to be smaller and the font color to Black. With those two pieces in place, we should end up with something similar to Figure 5.

Figure 5. Completed Textbox for Header
Line
The line is just as it sounds: a line. Use this item to create visible/visual report sections in your report. For example, this would work great if you are creating a two-column "newspaper-look" to your report and want to separate the two columns. Also, you can use this to separate the title and the rest of the data on your report. If we add a green line to our existing header, we end up with the picture in Figure 6.

Figure 6. Completed Textbox and Line for Header
Rectangle
The next item in our list, the rectangle, is very powerful. The rectangle allows us to group other report items together, as well as create an outline around multiple child items. We can also use the rectangle to set properties for multiple nested items together.
For this report, pull a Rectangle item over from the Toolbox onto the body of our report. Then drag two textboxes to the inside of the rectangle. You can be sure that they have landed inside the rectangle by pushing the Esc key while the textbox is selected. If the focus moves to the rectangle, you’re all set! If it moves to the body of the report, trying moving the textbox again to reset its parent container. The final view of the items can be seen in Figure 7.

Figure 7. Rectangle with two nested Textboxes
Image
The image allows you to display a picture on your report. This can be used to add your company logo to your report, or it can be used to display images that you store in your database. You have the option of pulling the image from an external source or embedding it into the report itself. Keep in mind that embedding the image will increase the size of the report, while pulling it externally will show whatever is in that external location when the report is rendered.
Let's add a company logo to our report. Begin by pulling the Image item from the Toolbox onto the Report Header. The Image Properties window will appear which allows you to select the image source and location of the image. For this example, we will use an embedded image that we imported from our local machine. The Image Properties window should look similar to Figure 8. We also have the ability to adjust our picture's size, visibility, action, and border.
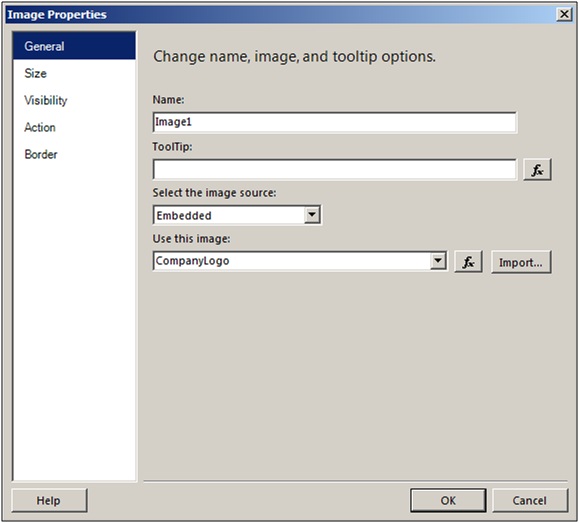
Figure 8. Image Properties Screen
Parameter
Last, but certainly not least, are parameters. Parameters are the way that end users can interact with the report itself by passing in values for a variable. We can either use the parameter values directly in the report or in a query, as described in the Step 3 article. For now, let’s use the value directly in the report.
Begin by selecting the New > Parameter option in the Report Data pane, as shown in Figure 9.
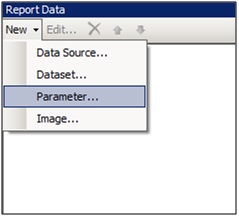
Figure 9. Add new parameter Screen
We will create a parameter that tells the report whether to hide or show all of the information in the rectangle. Fill out the Report Parameter Properties screen as shown in Figure 10. On the Available Values menu, you can also add two label and value pairs: True/True and False/False. Finally, add a value of True on the Default Values menu.
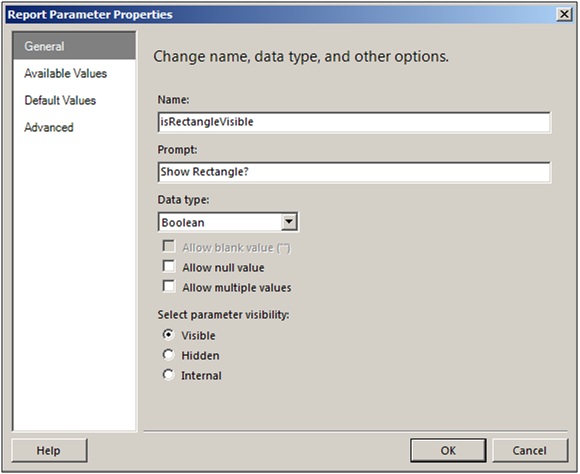
Figure 10. Report Parameter Properties
While this is enough to set up our parameter to pass information into the report, we have to actually use the information! In this situation, we will go to the properties of the Rectangle. For the Hidden parameter, add the following expression: =Not(Parameters!isRectangleVisible.Value), as shown in Figure 11.
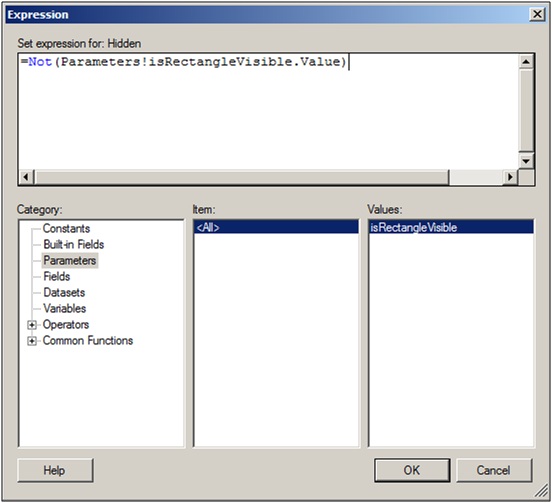
Figure 11. Expression for Textbox’s Hidden Property
By running the report and toggling the parameter value, we can easily display or hide our rectangle and everything in it, as shown in Figure 12 versus Figure 1.
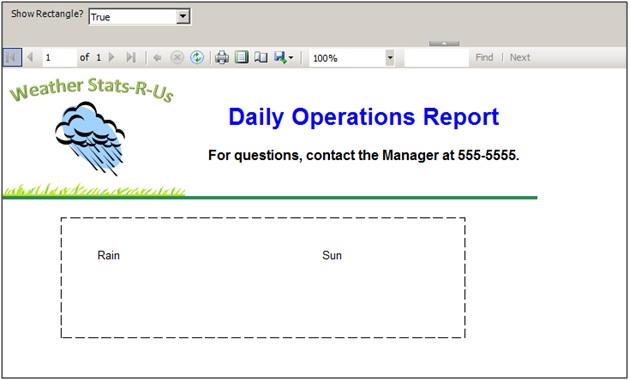
Figure 12. Final report showing Extra report items with parameter set to True
All Prettified Up
Hopefully, we’ve seen how the “extra” items in Reporting Services can be very powerful. By using rectangles, textboxes, and images, we can make our reports provide more useful and attractive looking information. Parameters provide the unique ability of passing information into our report from a user, allowing us to modify both the data and items shown.
You crumple up the blue note and toss it into the waste can. Thanks to the SSRS Stairways series, you’ve crossed another item off your to-do list. Next, you will learn how to use code and expressions to customize your report in the eighth article, Report Customization.
