You dig furiously through the stack of printed Excel spreadsheets, Access reports, and handwritten notes provided by your manager. You need descriptions from this source, metrics from that source, and filters from another source. How are you ever going to get anything done with all of this data everywhere?
Take a deep breath. Now take another deep breath. SSRS in a Flash comes to the rescue again! This article discusses everything you could ever want to know about connecting and retrieving data from everywhere. If you haven’t read the first two articles, please see:
- SSRS In a Flash - Level 1 in the Stairway to Reporting Services
- The Basics of SSRS - Level 2 in the Stairway to Reporting Services
P.S. Don’t forget to breathe out.
Data, Data, Data
The entire purpose of a report is to display data. Although the information may be from a variety of sources, the end result provides data to the end user. To this purpose, you need two report items that focus on data when developing reports: data sources and datasets.
Data Sources
A data source contains the information needed to retrieve data from a location. This information could be a connection string, in the case of a SQL Server database or an Analysis Services database, or it could be a URL, in the case of a public web service. The data source will tell Reporting Services how to connect and what security credentials should be used.
Reporting Services contains two types of data sources:
- A shared data source abstracts the data link outside the report. Shared data sources can be used by multiple reports and are uploaded separately to the report server.
- Just as it sounds, an embedded data source lives inside of a particular report. It cannot be reused across reports and is not accessible outside of the report.
A common application scenario is to change from where the data comes. This could happen in an environment promotion when it is necessary to change a server name from the development to test to production environments, or this could happen if a database name changes due to a new naming standard. Because we know these types of changes will occur, I highly recommend using a shared data source for all of your reporting needs. Let’s walk through creating a shared data source.
Creating a Shared Data Source
Begin by opening up Business Intelligence Development Studio (BIDS). After creating a Reporting Services project, you’ll see the Shared Data Sources folder in the Solution Explorer. Right click on the Shared Data Sources folder and select Add New Data Source, as shown in Figure 1.
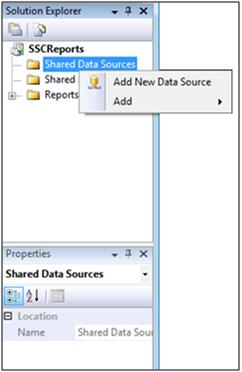
Figure 1. Shared Data Sources folder in Solution Explorer
Next, the data source wizard will open. After clicking through the initial screen if needed, you have the option to set the data source’s name, type, and connection strings. This Properties screen can be seen in Figure 2.
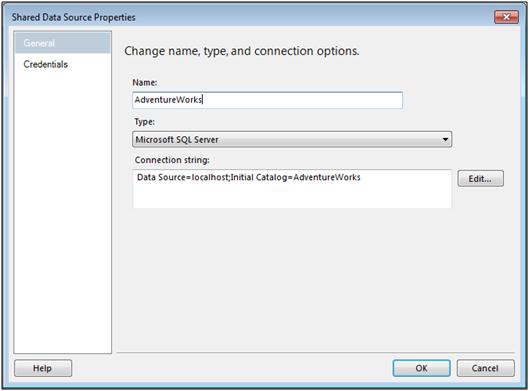
Figure 2. Shared Data Source Properties screen
Name your data source something that can be recognized by other report writers and is not specific to a particular environment. When creating a SQL Server data connection, the database name is a great choice. As of Reporting Services 2008 R2, you can connect to these following sources:
- Microsoft SQL Server
- Microsoft SQL Azure
- Microsoft SQL Server Parallel Data Warehouse
- OLE DB
- Microsoft SQL Server Analysis Services
- Oracle
- ODBC
- XML
- Report Server Model
- Microsoft SharePoint List
- SAP NetWeaver BI
- Hyperion Essbase
- TERADATA
To create the connection string, click the Edit… button next to the Connection String pane and enter the requested information. After filling out all information on the Properties pane, click OK, and you will see the data source you just created in the Solution Explorer.
Tying a Shared Data Source to a Report Data Source
In addition to creating the shared data source to be shared globally, you must tell the report which data source to use by creating a report data source. This can be done by using the Report Data pane in BIDS. Shown in Figure 3, right click on Data Sources and click the Add Data Source… selection.
Note: If you do not see the Report Data pane, you can open it by either clicking on the View menu -> Report Data selection or pressing Ctrl+Alt+D.
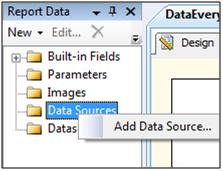
Figure 3. Report Data Pane to Add Data Source
Because you have already done the hard work of creating the shared data source, you can pick what you just created under the Use shared data source reference option and select OK. You can see this in Figure 4.
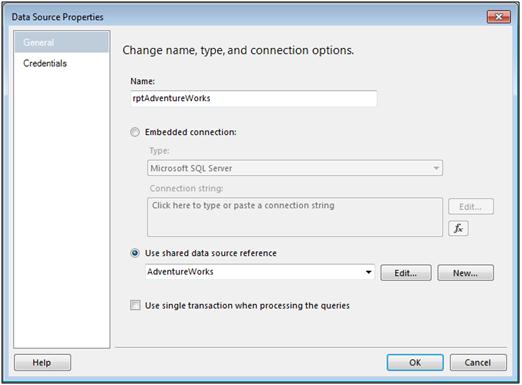
Figure 4. Data Source Properties Window
Now you are ready to start pulling some data!
Datasets
Once we have decided where the data lives, we need to tell Reporting Services what data should be returned. We create this through a dataset within Reporting Services. Similar to data sources, you can create two types of datasets:
· Shared datasets are only available in SQL Server 2008 R2 and above but can abstract the query out to be used by multiple reports
· Embedded datasets are stored in each individual report, and is what we will create in this article.
To begin creating an embedded dataset, let’s again look at the Report Data pane in BIDS. Right click on the Datasets folder and select Add Dataset… as shown in Figure 5.
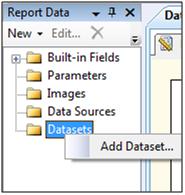
Figure 5. Report Data Pane to Add Dataset
Once open, you will fill out the Dataset Properties screen with an appropriate name, the data source, and the query that describes your data. Start by selecting a name that describes the data you will use. Keep in mind that you can have many datasets per report, so it needs to be specific enough to allow you to easily find the dataset you need; however, it also needs to be general enough so that if you need to add a few more fields, you don’t have to rename your dataset. I try to pick names that describe the type and grain of data, such as SalesByCustomer or SubUnitProperties.
In Reporting Services 2008 R2, you will select the option of Use a dataset embedded in my report, which allows you to select the data source that you just created. Finally, you can enter the query to pull data. For a data source of type Microsoft SQL Server, you can use either the Text or Stored Procedure option. Just as it sounds, the Stored Procedure option will allow you to select a stored procedure from the database. Using stored procedures is a great way to reuse data from other reports or applications. The next option, Text, allows you to write a query to pull the data back. See Table 1 for some sample queries based on the type of data source.
| Data Source Type | Sample Query |
| Microsoft SQL Server | select c.AccountNumber , soh.OrderDate , sum(soh.TotalDue) as TotalDue from Sales.SalesOrderHeader soh inner join sales.Customer c on soh.CustomerID=c.CustomerID where soh.OrderDate between @startDate and @endDate group by c.AccountNumber, soh.OrderDate |
| Microsoft SQL Server Analysis Services | SELECT NON EMPTY { [Measures].[Sales Amount], [Measures].[Tax Amt] } ON COLUMNS , NON EMPTY { ([Dim Customer].[First Name].[First Name].ALLMEMBERS * [Dim Customer].[Last Name].[Last Name].ALLMEMBERS ) } ON ROWS FROM [Adventure Works DW] |
| XML | <Query> <Method Name="DictionaryList" Namespace="http://services.aonaware.com/webservices"> </Method> <ElementPath IgnoreNamespaces="true">*</ElementPath> </Query> |
Table 1. Sample Dataset queries based on Data Source Type
A completed Dataset Properties Query window can be seen in Figure 6.
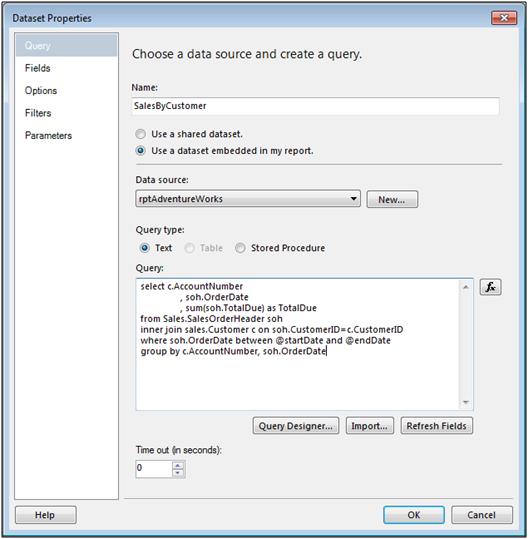
Figure 6. Dataset Properties Query Window
In the menu pane on the left of the Dataset Properties window, you will see four more options: Fields, Options, Filters, and Parameters. Click on the Fields option to ensure that your query syntax is correct and all expected fields are available. If there is a problem with anything you’ve done up to this point, the Fields option will either show an error or show no fields. The Options option provides some tweaks you can make to the dataset, including Collation, Subtotals, and more; although, these typically are not used very often. The Filters option will allow you to restrict the rows that shown on the report based on one or many columns compared to a value using operators including but not limited to: equals to, like, top N, and between. Finally, the Parameters option allows you to modify what query is sent to your data source. These query parameters are created based on the protocol of the data source, and the values passed in can be set dynamically from a user selection or based on run-time report values. The Parameters window can be seen in Figure 7. We will discuss the user selection parameters in a later article.
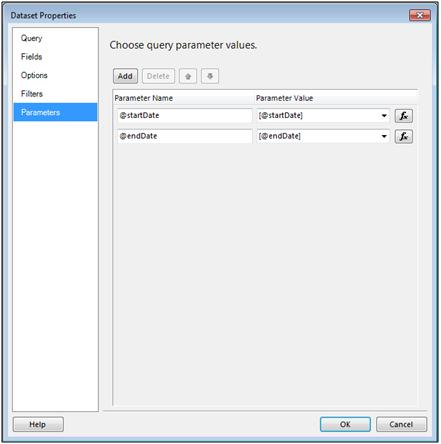
Figure 7. Dataset Properties Parameters Window
Once we click on OK, our dataset will appear in the Report Data pane. Clicking on the plus to the left of the dataset will show the fields available, as shown in Figure 8. You will start using these fields in our next article about the tablix report item.
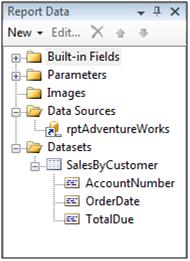
Figure 8. Final Data Source and Dataset in the Report Data Pane
What’s next?
By now, we’ve connected to all of the data sources and decided which data elements we want to use. We can re-use any of that information in another report or just focus on this report. For Big Boss’s report, you’ll need to learn how to display all of the data you just accessed. You need to group columns and rows, sort in certains ways, and format the data in different styles. You will learn all this and more in the next article in SSRS in a Flash, Tablix Tutorial.
