What is the best way to see Deadlocks info and take advantage of analyzing it?
-
April 9, 2021 at 3:33 pm
There was a 5 minute periods of time the other day when the lasting blocking (chains) caused by 1 spid culprit were really numerous, And then suddenly on minute 6 everything went through as if it was a clogged sewerage pile, and the CPU usage dropped and all, within seconds. And I am wondering how was it all resolved? (the code is a statement in a trigger that launches statement against same table in that trigger that causes same trigger to fire that accesses same table causing same trigger to fire over and over....)
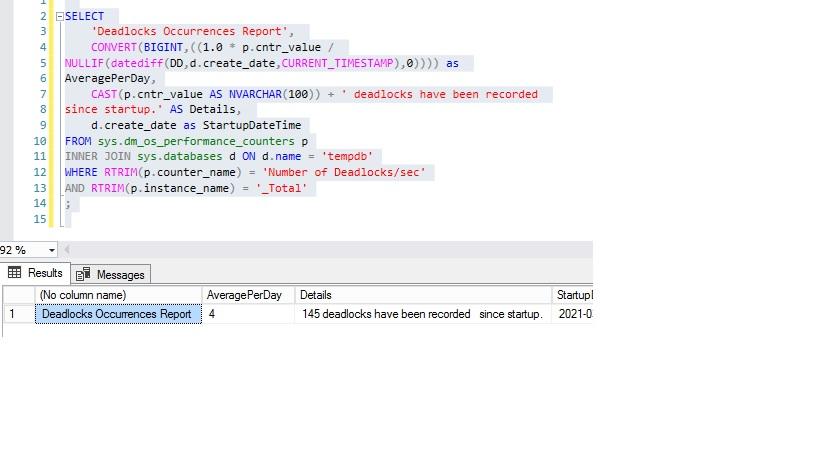
When I run the below query I see that 145 deadlocks happened in about a month since the server restart.
Yet when I run a code like the attached SP, to read the deadlock graphs from the default XE session (which I confirmed was always running), I do not see any. Why?
SELECT
    'Deadlocks Occurrences Report',
    CONVERT(BIGINT,((1.0 * p.cntr_value /
NULLIF(datediff(DD,d.create_date,CURRENT_TIMESTAMP),0)))) as
AveragePerDay,
    CAST(p.cntr_value AS NVARCHAR(100)) + ' deadlocks have been recorded
since startup.' AS Details,
    d.create_date as StartupDateTime
FROM sys.dm_os_performance_counters p
INNER JOIN sys.databases d ON d.name = 'tempdb'
WHERE RTRIM(p.counter_name) = 'Number of Deadlocks/sec'
AND RTRIM(p.instance_name) = '_Total'
;
;

Attachments:
You must be logged in to view attached files.Likes to play Chess
-
April 9, 2021 at 3:52 pm
dbcc tracestatus (1222,1204) returns all zeros.
so no info stored that way either. No other way to view the historical deadlock occurrences, right? Unless I myself write a collector or enable flag 1222?
Are
there
any down sides of enabling such flag?
Likes to play Chess
-
April 9, 2021 at 4:40 pm
Overhead. The default health trace contains deadlock info, although I prefer to create my own extended event specifically for deadlocks.
I have an alert that triggers a job when a deadlock occurs, so that I can capture the info immediately.
SQL DBA,SQL Server MVP(07, 08, 09) "It's a dog-eat-dog world, and I'm wearing Milk-Bone underwear." "Norm", on "Cheers". Also from "Cheers", from "Carla": "You need to know 3 things about Tortelli men: Tortelli men draw women like flies; Tortelli men treat women like flies; Tortelli men's brains are in their flies".
-
April 9, 2021 at 7:32 pm
Scott, but how does your alert know that a deadlock has occurred ? via what mechanism? Is it a SQL Agent Alert kind of alert?..
Likes to play Chess
-
April 9, 2021 at 8:41 pm
Yes, a standard Agent Alert, like below, but you need to change <instance name> to your actual instance name and the job id to your actual job id:
EXEC msdb.dbo.sp_add_alert @name=N'SQL_Server:Locks:Deadlocks/Sec>0',
@message_id=0,
@severity=0,
@enabled=1,
@delay_between_responses=0,
@include_event_description_in=0,
@category_name=N'[Uncategorized]',
@performance_condition=N'<instance_name>:Locks|Number of Deadlocks/sec|_Total|>|0',
@job_id=N'ffffffff-ffff-ffff-ffff-ffffffffffff'
SQL DBA,SQL Server MVP(07, 08, 09) "It's a dog-eat-dog world, and I'm wearing Milk-Bone underwear." "Norm", on "Cheers". Also from "Cheers", from "Carla": "You need to know 3 things about Tortelli men: Tortelli men draw women like flies; Tortelli men treat women like flies; Tortelli men's brains are in their flies".
Viewing 5 posts - 1 through 5 (of 5 total)
You must be logged in to reply to this topic. Login to reply
