Total Field On Monthly Grouped Matrix
-
May 13, 2019 at 1:56 pm
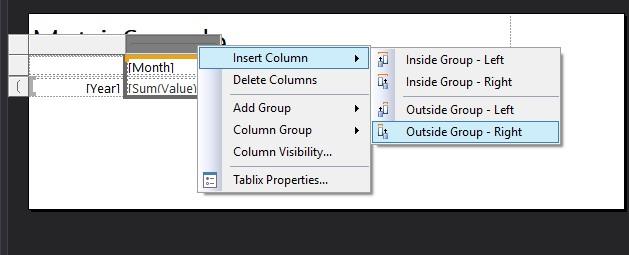
I have a matrix in which data for a 10 year period is averaged by month. The expression is on the month in order provide the grouping and the query to the source data sets the 10 year period. I can get the average monthly numbers but I need to sum the total of all of the averages in the Total column. I've included a layout in Excel of what I'm trying to do in reporting services. Does anyone have a suggestion?

-
May 13, 2019 at 3:37 pm
When I do that I get the sum of all sales instead of the sum of the average sales for each month. I keep going back to starting with this as an expression.
=sum(Fields!Sales.Value)
I'm hoping there is a way to specify the column group in the expression so that it will only sum the average sales per month.
-
May 13, 2019 at 3:45 pm
That's what I'm doing but it isn't coming back with the amount of 10,466,457 which is the sum of the average per month. The result of that formula is a number that is much higher because it is adding up all of the values in the data, not the average grouped by month.
-
May 13, 2019 at 3:57 pm
RonMexico wrote:That's what I'm doing but it isn't coming back with the amount of 10,466,457 which is the sum of the average per month. The result of that formula is a number that is much higher because it is adding up all of the values in the data, not the average grouped by month.
That's not the behaviour I'm getting; which does imply you're doing something else. As you can see in this quick mockup (I would attach the RDL, but attaching seems to have gone) this sums up the row, not everything.

Thom~
Excuse my typos and sometimes awful grammar. My fingers work faster than my brain does.
Larnu.uk -
May 13, 2019 at 4:00 pm
Wait... perhaps I need to read between the lines here. Is each cell an average of the set it's based on? If so, no
SUMwon't work as it's going to sum all the values that made up the average of that row (not the row itself).AVERAGEwould give you the average of all the rows too, not the sum of the averages.Are you really after the sum of the averages here? That seems like an odd thing to need, if I'm honest.
Thom~
Excuse my typos and sometimes awful grammar. My fingers work faster than my brain does.
Larnu.uk -
May 13, 2019 at 4:30 pm
I can't speak to using a matrix because I don't use SSRS. I do write stored procedures to provide info to SSRS and Excel, etc. If it were me, I'd write this into a stored procedure where I'd pre-aggregate the monthly averages in a CTE and then do a CROSS TAB (I don't like PIVOT for a bunch of reasons I wrote into an article a long time ago) from that where it would be easily possible to SUM the pre-aggregated monthly averages as a part of the CROSS TAB. Then someone take the output of that and convert it into a report.
--Jeff Moden
RBAR is pronounced "ree-bar" and is a "Modenism" for Row-By-Agonizing-Row.
First step towards the paradigm shift of writing Set Based code:
________Stop thinking about what you want to do to a ROW... think, instead, of what you want to do to a COLUMN.Change is inevitable... Change for the better is not.
Helpful Links:
How to post code problems
How to Post Performance Problems
Create a Tally Function (fnTally) -
May 13, 2019 at 5:09 pm
Thom - Yes, each cell is an average of the set it's based on. I totally agree it's a strange way to see a yearly average but that's how the business wants it so you know what that means. Is it feasible to use a function that sums an entire (dynamic) row?
Jeff - This report has led me to do some formatting and aggregates in SQL before bringing in the data so I'm definitely open to taking care of that ahead of time. This is also serving as a proof of concept so I want to make sure there isn't a more intuitive way by using SSRS.
-
May 14, 2019 at 2:07 pm
Jeff - How to do you suggest I add the total of all monthly averages to the result below
;

WITH AggCTE
AS (
SELECT DATENAME(mm, DateEntered) AS MonthChar
,Sales
FROM table1
)
SELECT *
FROM (
SELECT MonthChar
,Sales
FROM AggCTE
) AS SourceTable
PIVOT(Avg(Sales) FOR MonthChar IN (
January
,February
,March
,April
,May
,June
,July
,August
,September
,October
,November
,December
)) AS AvgSales
Viewing 10 posts - 1 through 9 (of 9 total)
You must be logged in to reply to this topic. Login to reply


