Please help me with a complex SELECT
-
June 30, 2017 at 6:17 am
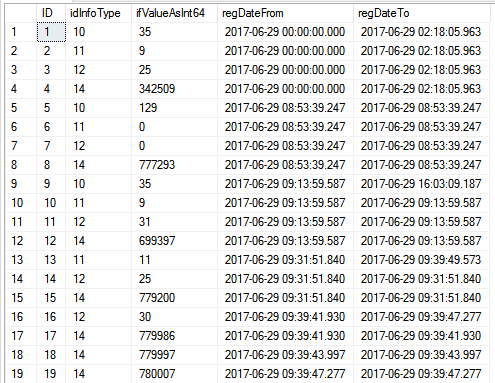
Hi, I got a table like this:

i need to convert it to a table with headers as following structure

but "date" ranges have to be considered carefully,
for instance if you have 2 records like this:
you're gonna be able to see the following result:

what is the best way to accomplish this regarding performance issues?
any help would be highly appreciated. -
June 30, 2017 at 6:31 am
Please post DDL and DML statements for the above table structure. so that it would be easy for others to address you.
-
June 30, 2017 at 7:03 am
salardx - Friday, June 30, 2017 6:17 AMHi, I got a table like this:
i need to convert it to a table with headers as following structure

but "date" ranges have to be considered carefully,
for instance if you have 2 records like this:
infoType:10 - ifValueAsInt64: 40 - dateRanges between 2016-01 and 2018-01
infoType:11 - ifValueAsInt64: 50 - dateRanges between 2017-01 and 2017-02
you're gonna be able to see the following result:
what is the best way to accomplish this regarding performance issues?
any help would be highly appreciated.A little extra work required here. Can you adjust the dates in your sample set so that your text explanation refers to dates which can be found within it, and your result set is accurate? It looks like a pretty straightforward pivot, but the description is too ambiguous to be sure.
For a bonus ball, you could set up your sample data as a CREATE TABLE and a series of INSERTs.“Write the query the simplest way. If through testing it becomes clear that the performance is inadequate, consider alternative query forms.” - Gail ShawFor fast, accurate and documented assistance in answering your questions, please read this article.
Understanding and using APPLY, (I) and (II) Paul White
Hidden RBAR: Triangular Joins / The "Numbers" or "Tally" Table: What it is and how it replaces a loop Jeff Moden -
June 30, 2017 at 7:23 am
ChrisM@Work - Friday, June 30, 2017 7:03 AMsalardx - Friday, June 30, 2017 6:17 AMHi, I got a table like this:
i need to convert it to a table with headers as following structure

but "date" ranges have to be considered carefully,
for instance if you have 2 records like this:
infoType:10 - ifValueAsInt64: 40 - dateRanges between 2016-01 and 2018-01
infoType:11 - ifValueAsInt64: 50 - dateRanges between 2017-01 and 2017-02
you're gonna be able to see the following result:
what is the best way to accomplish this regarding performance issues?
any help would be highly appreciated.A little extra work required here. Can you adjust the dates in your sample set so that your text explanation refers to dates which can be found within it, and your result set is accurate? It looks like a pretty straightforward pivot, but the description is too ambiguous to be sure.
For a bonus ball, you could set up your sample data as a CREATE TABLE and a series of INSERTs.yes, pivot is required, but in a special way that give us the solution
for instance if you have 2 records like this:
Click to enlarge
you're gonna be able to see the following result:
Click to enlarge
-
June 30, 2017 at 7:31 am
Please take heed of the requests for sample data, in a consumable format (see the link in my signature for details).
And when you provide desired results, make them match the sample data which you have provided.
Take the time to do this and someone will provide a working solution for you. -
June 30, 2017 at 7:31 am
Hi....a word to the wise....please read this article and respond accordingly...you will be amazed how many tried and tested answers you get....it helps us help you.
https://spaghettidba.com/2015/04/24/how-to-post-a-t-sql-question-on-a-public-forum/
________________________________________________________________
you can lead a user to data....but you cannot make them think
and remember....every day is a school day
Viewing 6 posts - 1 through 6 (of 6 total)
You must be logged in to reply to this topic. Login to reply


