filling in even the group by cells
-
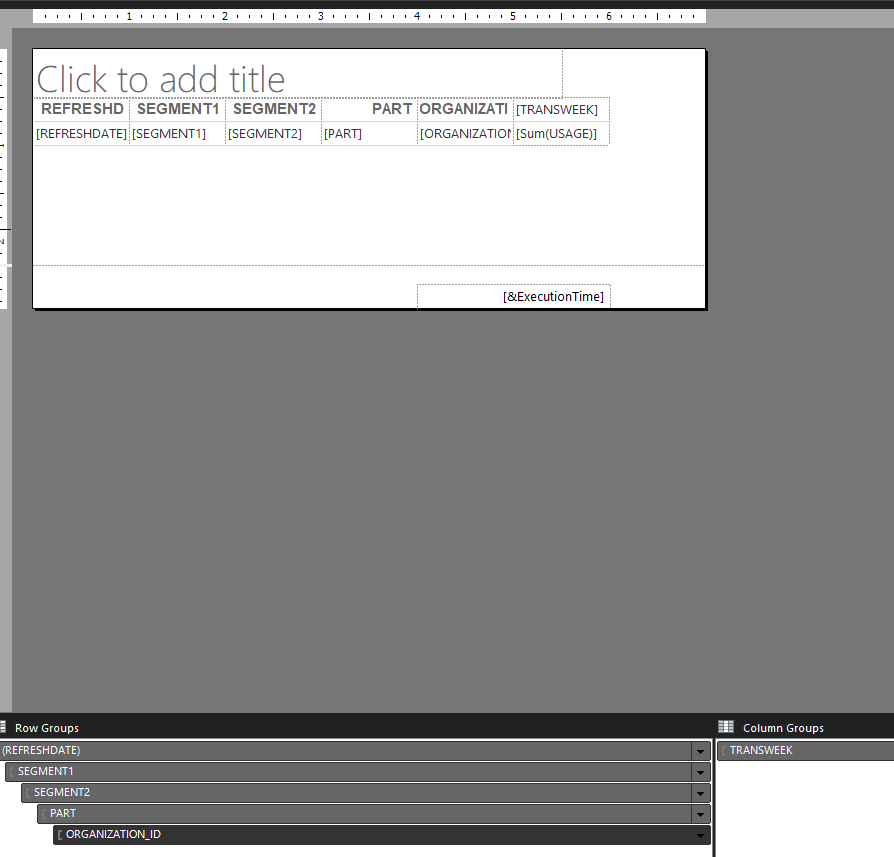
hi we have a report that groups on the fields you see below per row, and on "week" in columns. It sums a usage figure.
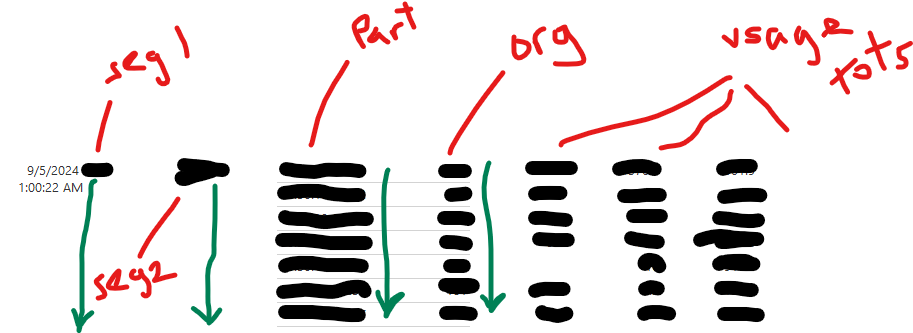
my peer would like to know if there is a way to fill the cells downward on all the row groupings cells even if they repeat. that way his users can save to excel and do their thing without worrying about blank cells. the green lines are where he'd like to ensure even repeating values display. i already told him that a pivot in combo with a non grouped ssrs table visual is also an option. ie a solution where the query rather than ssrs does all the heavy lifting. but it would help us to understand if this is possible without such a query.


-
September 5, 2024 at 7:27 pm
saving to csv doesnt quite cut it as it unpivots the usage data.
-
I imagine you already searched the Internet before posting, but this looks like it might work
-
September 6, 2024 at 12:46 pm
thx phil. this is more about the cell data. not headers. i tried reading the 3 or so options at https://stackoverflow.com/questions/868064/ssrs-repeat-tablix-left-most-row-group-value-on-each-row .
one (row number option) doesnt really apply if you are asking ssrs to do the aggregations. i'll try re reading the other 2 as they had statements like you see below which threw me off...
"You can simply edit the upper reporting level, to be grouping on both groups at the same time, this will cause your desired behaviour."
-
September 6, 2024 at 1:14 pm
thx for making me look again phil. hidden in all that noise was this nugget which did the trick....

Viewing 5 posts - 1 through 5 (of 5 total)
You must be logged in to reply to this topic. Login to reply


