Confused about CountRows
-
I have this table:
CREATE TABLE #temptable ( [ProductName] varchar(100), [ProductLevel1] varchar(20), [ProductLevel2] varchar(20), [ProductLevel3] varchar(20) )
INSERT INTO #temptable
VALUES
( 'Product A', 'somecat', 'other cat', 'thirdcat' ),
( 'Product B', 'somecat', 'other cat', 'thirdcat' ),
( 'Product C', 'somecat', '', 'thirdcat' ),
( 'Product D', '', 'other cat', 'thirdcat' ),
( 'Product E', '', 'other cat', '' ),
( 'Product F', '', 'other cat', '' )

DROP TABLE #temptable
I created this column in Power BI:
No_Level3 = counta(UserSample[OrgLevel3])
This gets me 6 for all rows. Makes sense. I make a measure that is this:
CM Level 3 = COUNTAX(UserSample, UserSample[OrgLevel3])
Supposedly this doesn't count empty rows, but I Get 6 for each row, and a 6 in a visualization.
Is there a reason I don't get 4?
-
I believe it's because an empty string in Power BI is a value. Try using nulls instead and see if you get the intended behavior.
'' <> Blank() in Power BI
- Martin Schoombee wrote:
I believe it's because an empty string in Power BI is a value. Try using nulls instead and see if you get the intended behavior.
'' <> Blank() in Power BI
Just to be sure, an empty string in SQL Server is also a value.
--Jeff Moden
RBAR is pronounced "ree-bar" and is a "Modenism" for Row-By-Agonizing-Row.
First step towards the paradigm shift of writing Set Based code:
________Stop thinking about what you want to do to a ROW... think, instead, of what you want to do to a COLUMN.Change is inevitable... Change for the better is not.
Helpful Links:
How to post code problems
How to Post Performance Problems
Create a Tally Function (fnTally) -
Thanks, Martin. I'll experiment with that. I wasn't sure what this meant from the docs, and when working in a Power BI Data model, it can be hard to tell what someone else has in their model. I don't see "null" being displayed there.
-
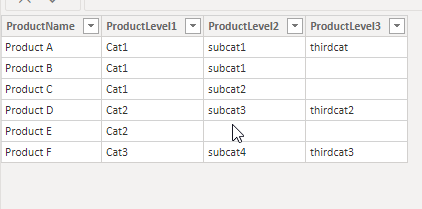
That appears to be the issue. If I use NULLS, with this code:
CREATE TABLE ProductSample ( [ProductName] varchar(100), [ProductLevel1] varchar(20), [ProductLevel2] varchar(20), [ProductLevel3] varchar(20) )
INSERT INTO dbo.ProductSample
    (ProductName
  , ProductLevel1
  , ProductLevel2
  , ProductLevel3)
VALUES
( 'Product A', 'Cat1', 'subcat1', 'thirdcat' ),
( 'Product B', 'Cat1', 'subcat1', '' ),
( 'Product C', 'Cat1', 'subcat2', null ),

( 'Product D', 'Cat2', 'subcat3', 'thirdcat2' ),
( 'Product E', 'Cat2', null, null ),

( 'Product F', 'Cat3', 'subcat4', 'thirdcat3' )
I see the data model as this:

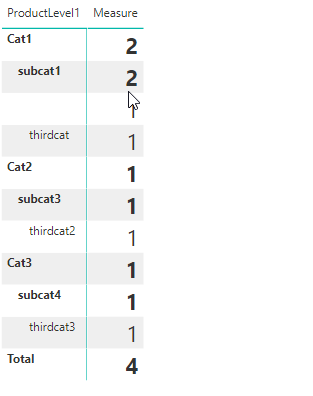
And the report matrix looks more correct.
Thanks for the help
-
No worries..always fun to figure out what gets translated to what in the different tools.
Viewing 6 posts - 1 through 6 (of 6 total)
You must be logged in to reply to this topic. Login to reply