Compare queries
-
December 21, 2021 at 6:51 am
On what basis should i compare performance of queries?
Query 1:
select * from dbo.Table1 where [T1_col1] like '%string%'
Query 2:
select Table1.* from Table1 left join db2.dbo.Temp on Table1.num=db2.dbo.Temp.num where db2.dbo.Temp.[col1]='string'
Query 3:
select * from dbo.Table1 where num in (select num from db2.dbo.Temp where [col1]='string')
Query 1 is my actual query that executes thousands of time in a day. It being non sargable , I want to convert it into a sargable query (creating child table and querying it), hence query 2 and 3. The problem now is I am not sure how to compare the performance of these queries.
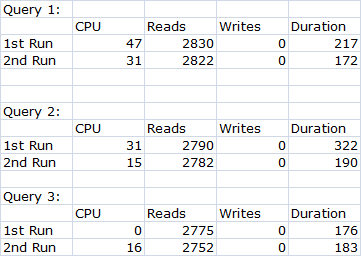
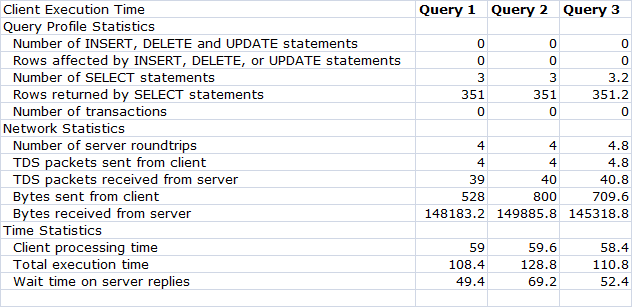
The tracer, client statistics and statistics IO values I have given are not constant (for example queries will have varying CPU time of 0 and 12ms each time I execute the query).All three methods gave different results.
Time and IO statistics = ON I get following results
Query 1:
Scan count 1, logical reads 1987, physical reads 2, read-ahead reads 390, lob logical reads 0, lob physical reads 0, lob read-ahead reads 0.
SQL Server Execution Times:
CPU time = 12.4 ms, elapsed time = 213 ms.
Query 2:
Scan count 0, logical reads 1882, physical reads 1, read-ahead reads 265, lob logical reads 0, lob physical reads 0, lob read-ahead reads 0.
Scan count 1, logical reads 4, physical reads 1, read-ahead reads 2, lob logical reads 0, lob physical reads 0, lob read-ahead reads 0.
SQL Server Execution Times:
CPU time = 3.2 ms, elapsed time = 175.2 ms.
Query 3:
Scan count 0, logical reads 1892, physical reads 1, read-ahead reads 265, lob logical reads 0, lob physical reads 0, lob read-ahead reads 0.
Scan count 1, logical reads 4, physical reads 1, read-ahead reads 2, lob logical reads 0, lob physical reads 0, lob read-ahead reads 0.
SQL Server Execution Times:
CPU time = 3 ms, elapsed time = 166.6 ms.
Tracer result:
Client Statistics result :
So according to these 3 methods I'm not able to derive a conclusion as to which of my queries would perform better.
All the queries were run on a database have 50000 rows of data.
Any solution for this? Feel free to ask for any other details if required.
- This topic was modified 4 years, 2 months ago by IT researcher.
- This topic was modified 4 years, 2 months ago by IT researcher.
-
December 21, 2021 at 2:32 pm
I saw you posted this over on DBA.StackExchange. I like the one answer. There were also good comments. From the bytes received, it looks like each query returns different data? It's hard to compare performance when varying amounts of information is being moved around.
There's a bunch of stuff going on here, but I can only talk in generalities since I can't see the code or your structures. Let's assume we have three ways of querying the data. Each one returns identical information (that's key because otherwise, we're not making real comparisons, after all, a query for one row, probably runs faster than a query for 50,000 rows, although, not always). There are three key metrics we look at, and I look at all three. CPU, I/O & Time. However, there are additional wrinkles.
First up, compile time. The first time you run one of these queries, it's likely to need to compile. That's going to add CPU & Time. How do you get around this? Run the query at least twice. Or, run each query once to get them compiled, then capture the metrics.
However, you're also looking at another issue, resource use. If you run a query two times, you may see two different Time or CPU values (generally, you'll always see the same I/O values because it's not a measure, but a count of pages). This is because other resources may be causing your query to wait a little longer on resources between executions. How do you get around this? Run the query a lot more than twice. I run them 50 times each and then average the values in order to take into account variations within the system caused by resource contention.
You also have to deal with another issue. Capturing metrics adds overhead. Different methods have different impacts. Personally, I use Extended Events. It has the most accuracy with the least impact. Also, the Live Data Explorer window lets me quickly group & aggregate the runs on the query so I can see the average. SET STATISTICS TIME is accurate. However, SET STATISTICS IO, while being more detailed than Extended Events (and it's useful because of this), actually affects the time required to retrieve the data. This is because it adds a bunch of extra information that impacts time measurements. Also, if you're capturing execution plans with the query, it impacts runtime metrics, so you have to be sure you're capturing them separately. Plans for one execution. Metrics for another.
Which brings us to another point. The execution plans. You have three queries. They seem to be roughly the same in terms of performance. What do the execution plans show? Is one of them doing a scan, that's likely to degrade in performance over time while the other does a seek (assuming a seek is more appropriate for the query, sometimes it's not)? Well then, we're probably better off using the version that has the seek. Or, all the plans are the same? Again, possible, not always likely, so which query do you use then? Any of them if they're resolving the same way.
One final point too. A given query may run faster, but uses more I/O. Is that good or bad? Well, where are the bottlenecks on your system? Can you sacrifice I/O to get better performance? Another query may run slower, but uses less I/O. Are you bottlenecking on I/O? Then reducing I/O is a win, even if the query runs a little longer.
In short, there's not a single right, easy, answer here. There are a lot of factors involved. It's frequently a balancing act to make the determination.
I hope this helped a little.
"The credit belongs to the man who is actually in the arena, whose face is marred by dust and sweat and blood"
- Theodore RooseveltAuthor of:
SQL Server Execution Plans
SQL Server Query Performance Tuning -
December 22, 2021 at 1:16 am
There's also the possibility that all 3 queries actually suck. 😀 You'll need to look at the execution plans, as well. Just don't make the mistake of using % of Batch or anything else that might indicate duration as a measure of which is best.
As for SET STATISTICS, you have to be double careful there because if anything like a Scalar Function or an MTVF (Mult-statement Table Valued Function) is invovled, SET STATISTICS TIME will not be correct. See the following article for that.
https://www.sqlservercentral.com/articles/how-to-make-scalar-udfs-run-faster-sql-spackle
And, yeah... the problem with 3 different built in tools returning 3 different sets of numbers is a bit maddening. Add in SQLProfiler and Extended Events and you'll go 66% more insane. 😀
Now... all that being said, you're working with a trivial amount of data and even Windows and SQL Server background code can cause a difference here. What happens if you build some test data with a million or more rows and do a test of your queries again?
--Jeff Moden
RBAR is pronounced "ree-bar" and is a "Modenism" for Row-By-Agonizing-Row.
First step towards the paradigm shift of writing Set Based code:
________Stop thinking about what you want to do to a ROW... think, instead, of what you want to do to a COLUMN.Change is inevitable... Change for the better is not.
Helpful Links:
How to post code problems
How to Post Performance Problems
Create a Tally Function (fnTally) -
December 22, 2021 at 9:34 am
When I run the same query multiple times why does the CPU time fluctuate between 0 and 16ms in tracer, query cost and live data explorer? Also I have updated the queries and my reasons in the question .
-
December 22, 2021 at 12:30 pm
IT researcher wrote:When I run the same query multiple times why does the CPU time fluctuate between 0 and 16ms in tracer, query cost and live data explorer? Also I have updated the queries and my reasons in the question .
Without running a debugger, you're never going to know exactly what's going on 100%. Instead, simply accept that there's variability in these measurements. That's why I go with multiple executions and an average. It takes into account that I'm simply going to see some differences (usually not with I/O, but CPU & Time, absolutely).
Also, because of the variability, while there are like 9 ways (pretty sure it's 9) to measure query performance, you should focus on the ones that are more accurate, and more usable. As stated, I use Extended Events, and add to that the DMVs and Query Store. I only use SET STATISTICS IO when I need detailed measurements there. Otherwise, I get what I need from those sources.
So, your two replacement queries. First up, don't compare them to the first query. You're comparing apples to hammers. They're no longer the same since you're joining to another table & such. Second, you can look at the plans and spot the one that is likely better. Do you think two index seeks and a nested loops is doing less work than two index seeks, a nested loops, and an aggregate? 3 things instead of 4. Probably, that's going to be the better performing query in most circumstances. However, measure it the way I suggested.
I prefer the JOIN method. It's clearer in terms of code. However, you could also test EXISTS instead of IN. Measure that one & see how it goes.
"The credit belongs to the man who is actually in the arena, whose face is marred by dust and sweat and blood"
- Theodore RooseveltAuthor of:
SQL Server Execution Plans
SQL Server Query Performance Tuning -
December 23, 2021 at 2:06 am
Just out of curiosity, you do realize that the first query is totally different than the other 2, correct? And you do realize that leading wild cards for criteria are guaranteed to do an index scan or a table scan, correct? And why do you need to return all columns from Table1? That usually means a guaranteed "lookup" if a non-clustered index meets the criteria to find the data but doesn't contain all the data to be returned.
--Jeff Moden
RBAR is pronounced "ree-bar" and is a "Modenism" for Row-By-Agonizing-Row.
First step towards the paradigm shift of writing Set Based code:
________Stop thinking about what you want to do to a ROW... think, instead, of what you want to do to a COLUMN.Change is inevitable... Change for the better is not.
Helpful Links:
How to post code problems
How to Post Performance Problems
Create a Tally Function (fnTally) -
December 28, 2021 at 10:37 pm
Making some assumptions based upon experience, I'm guessing that the first query using like '%string%' is the original code that's been in place for a long time?
If so, have you re-defined the requirements? Are you sure that this will generate the desired results? You may not need the leading wildcard.
If this is a search screen, determine the most common set of parameters being used, and tune for the "majority". Then for the lesser-used parms, let them wait!
Michael L John
If you assassinate a DBA, would you pull a trigger?
To properly post on a forum:
http://www.sqlservercentral.com/articles/61537/
Viewing 7 posts - 1 through 7 (of 7 total)
You must be logged in to reply to this topic. Login to reply

