Back in January 2016, I wrote a blog post explaining a DAX workaround that allows you to put measures on rows in a matrix in a Power BI report. I’m happy to say that you no longer need my workaround because you can now natively put measures on rows in a matrix in both Power BI Desktop and PowerBI.com.
This is accomplished via a new formatting option for the matrix.
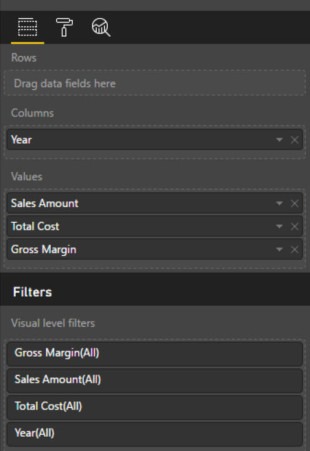
As a quick example, I made a table with years on columns and measures in my values (and nothing on rows). I added three measures: Sales Amount, Total Cost, Gross Margin.
Initially, my matrix puts the measures across the columns.
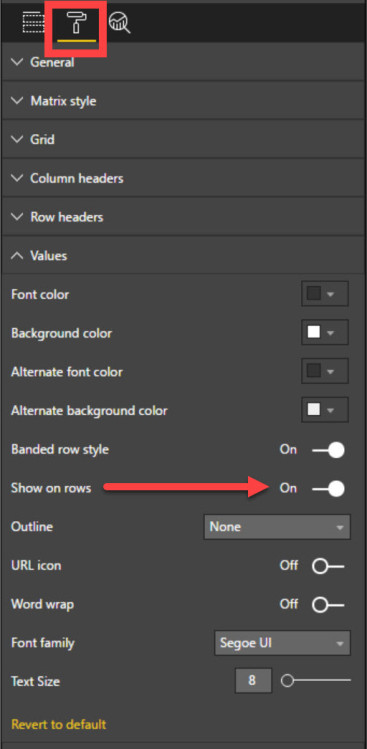
But I can change that in the formatting options.
Find the Values section on the formatting pane and look for Show On rows. Toggle that switch to On.
And that gives you the three values on rows.


