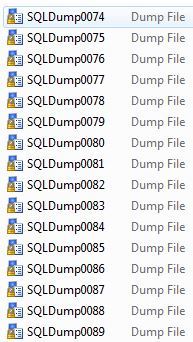
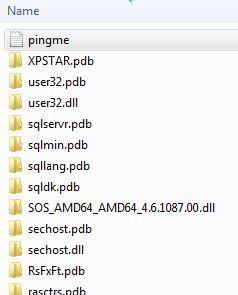
I have a SQL Server that is constantly producing “dump” files (with a MDMP File type), these are named SQLDumpxxxx (xxx = numerical value). They are located in the following directory: C:\Program Files\Microsoft SQL Server\MSSQL12.MSSQLSERVER\MSSQL\Log\ – sound familiar?
Have a look at this screen shot – it’s messy!
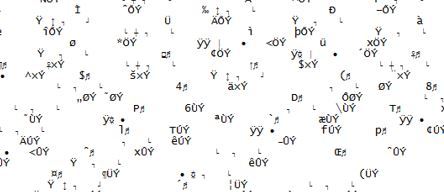
Try and open one of these in notepad and you will be presented with amazing mind bending patterns.
Naturally, I am a curious person. I had an urge to read the contents of these files. If you are like me then hopefully after reading this post, you will be able to do so. (You won’t solve anything by this unless you know how to decipher the call stacks, for me it’s a curiosity satisfying task – something is better than nothing)
Get the right tools
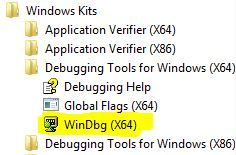
A key element is the need to have certain tools. Personally I downloaded Debugging Tools for Windows (from here: https://docs.microsoft.com/en-us/windows-hardware/drivers/debugger/index). Once installed you will see the famous WinDbg tool within your menu.
Let the fun begin
First step is to set your symbols.
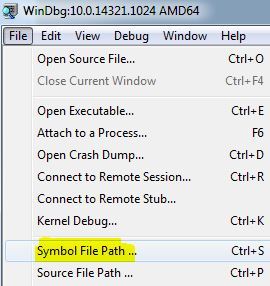
Within the text box enter the following:
SRV*c:\symbols*http://msdl.microsoft.com/download/symbols
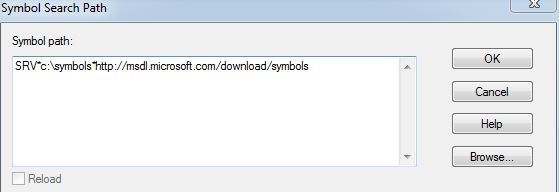
Obviously you will need to create a folder called symbols on C.
http://msdl.microsoft.com/download/symbols is not browseable, it is provided by Microsoft to enhance debugging by automatically retrieving symbols for various Microsoft products during a debugging session.

If you have already downloaded symbols to a folder called C:\symbols\ then browser to it instead.
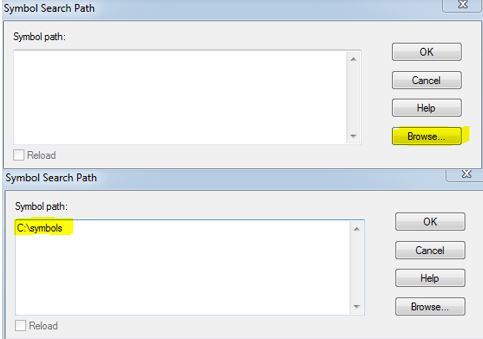
With that bit sorted next you navigate to the dump file and click OK.
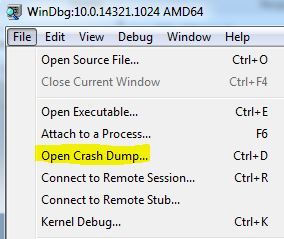
Doing the basics
Disclaimer: I only issue basic commands, when in the WinDBG command line you can issue all sorts, but for someone like me there is no real point.
Select the file and let it go to work – you will see BUSY messages.
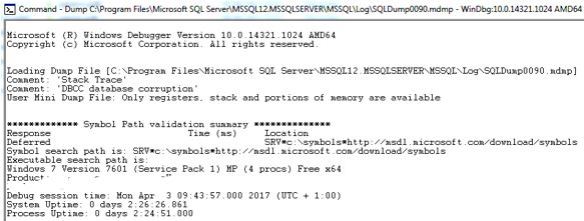
I already have some good information, more specifically that this is a mini dump file with the comment DBCC database corruption, this doesn’t surprise me. I am notorious for hacking / corrupting databases.
For the next bit I run:
! analyse -v
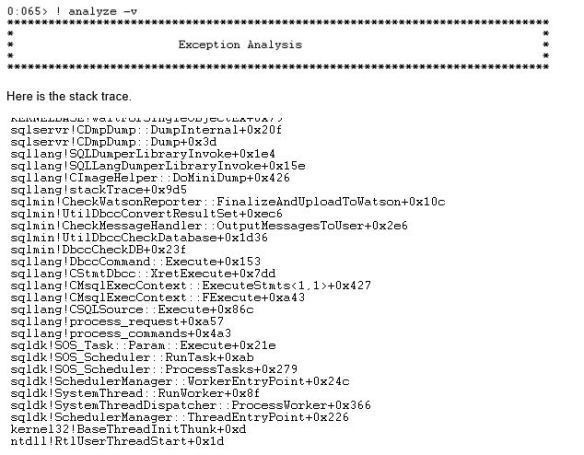
What this is telling me is that the I enabled sending of useful information to Microsoft, so it will generate a Watson dump whenever a CHECK* command finds a corruption, which links back to the first screen shot around the comment of corruption. (Thanks Paul Randal for answering my questions on this).
Here is the application fault and sqllang file being highlighted.

Let me tell you, it was 100% down to corruption. Here is the proof.

There is another way to get to this, which is via
.dml_start
and click on the Analyse_last_event.
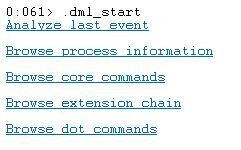
To browse process information (the second link above) it will do the following:
!dml_proc

Clicking on the .exe will drill down to Thread IDs
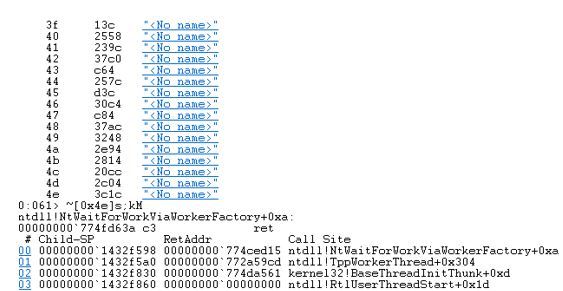
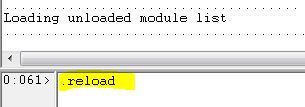
A little tip which I found useful, if you change your c:\symbols\ folder contents you can issue a .reload from your console. The command does not actually cause symbol information to be read. It just lets the debugger know that the symbol files may have changed.
Happy debugging!
Filed under: Admin, Corruption, SQL SERVER Tagged: Corruption, Dump Files, Kits, SQL server, StackTrace, Technology, WinDBG
![]()


