 In this brave, new world of Extended Events (XE, XEvents), I find myself with a mixture of scripts for troubleshooting issues – some use XE, and some use traces. We’ve all been told that XE is a much better system (it is much more lightweight, causing less of an issue with the server). In fact, it is so much better that Microsoft has deprecated SQL Trace and SQL Profiler, and in the future, one will not be able to run any traces at all. Believe it or not, this is a good thing!
 It just so happens that today is the 67th installment of the monthly T-SQL Tuesday blogging event. T-SQL Tuesday, that wonderful monthly blogging party started by Adam Machanic where a selected host challenges the SQL Server universe to have a blog post about a specific topic. This wild frenzy of SQL Server blog posting occurs on the second Tuesday of each month. This month, it is being hosted by my friend (and the person with the highest amount of energy known to mankind) Jes Borland (b / t), and the topic that she has chosen is Extended Events. Her specific challenge to the SQL Server universe is:
I want to know (and others do, too) how you’ve solved problems with Extended Events. What sessions have you created? What unique way have you used predicates or targets? What challenges have you overcome?
The biggest challenge that I have is not a technical challenge… it’s a personal challenge: actually getting started with XE. I have so many scripts for doing traces, that I just immediately use them instead of the better XE system. I really need to wean myself off of using Profiler / traces. Therefore, I’ve decided to start converting my trace scripts into XE scripts, and I’ll share with you how I go about doing it. Today, I’m going to look at my favorite trace script – a trace to capture deadlock information.
First off, let’s start with the trace script:
-- Create a trace to capture deadlocks
DECLARE @rc INTEGER,
        @TraceID INTEGER,
        @maxfilesize BIGINT,
        @OutputFileName NVARCHAR(256),
        @TraceStopTime DATETIME,
        @on BIT,
        @intfilter INT,
        @bigintfilter BIGINT;

SET @on = 1;
SET @maxfilesize = 10; --mb
DECLARE @FileName NVARCHAR(256);
-- added InstanceName for when server is running multiple instances
SET @FileName = N'C:\SQL\Traces\' + CONVERT(sysname, SERVERPROPERTY('InstanceName')) + '\' +
               CONVERT(CHAR(8), GETDATE(), 112) + '_' +
               REPLACE(CONVERT(CHAR(8), GETDATE(), 114), ':', '');
EXECUTE xp_create_subdir @FileName;
SET @FileName = @FileName + N'\' + REPLACE(@@SERVERNAME, N'\', N'_') + '_DeadlockTrace_' + CONVERT(CHAR(8), GETDATE(), 112) + N'_' + REPLACE(CONVERT(CHAR(8), GETDATE(), 114), N':', N'') + N'Z';
PRINT @FileName;
SET @TraceStopTime = DATEADD(HOUR, 6, GETDATE());
EXEC @rc = sp_trace_create @TraceID output, 2, @FileName, @maxfilesize, @TraceStopTime;

IF (@rc != 0) GOTO error

-- Set the events
-- Event 148: Deadlock Graph
EXEC sp_trace_setevent @TraceID, 148, 1, @on;   -- TextData
EXEC sp_trace_setevent @TraceID, 148, 11, @on;  -- LoginName
EXEC sp_trace_setevent @TraceID, 148, 12, @on;  -- SPID
EXEC sp_trace_setevent @TraceID, 148, 14, @on;  -- StartTime
-- Event 25: Lock:Deadlock
EXEC sp_trace_setevent @TraceID, 25, 1, @on;    -- TextData
EXEC sp_trace_setevent @TraceID, 25, 2, @on;    -- BinaryData
EXEC sp_trace_setevent @TraceID, 25, 6, @on;    -- NTUserName
EXEC sp_trace_setevent @TraceID, 25, 9, @on;    -- ClientProcessID
EXEC sp_trace_setevent @TraceID, 25, 10, @on;   -- ApplicationName
EXEC sp_trace_setevent @TraceID, 25, 11, @on;   -- LoginName
EXEC sp_trace_setevent @TraceID, 25, 12, @on;   -- SPID
EXEC sp_trace_setevent @TraceID, 25, 13, @on;   -- Duration
EXEC sp_trace_setevent @TraceID, 25, 14, @on;   -- StartTime
EXEC sp_trace_setevent @TraceID, 25, 15, @on;   -- EndTime
EXEC sp_trace_setevent @TraceID, 25, 22, @on;   -- ObjectID
EXEC sp_trace_setevent @TraceID, 25, 32, @on;   -- Mode
EXEC sp_trace_setevent @TraceID, 25, 35, @on;   -- DatabaseName
EXEC sp_trace_setevent @TraceID, 25, 57, @on;   -- Type
-- Event 59: Lock:Deadlock Chain
EXEC sp_trace_setevent @TraceID, 59, 1, @on;    -- TextData
EXEC sp_trace_setevent @TraceID, 59, 2, @on;    -- BinaryData
EXEC sp_trace_setevent @TraceID, 59, 12, @on;   -- SPID
EXEC sp_trace_setevent @TraceID, 59, 14, @on;   -- StartTime
EXEC sp_trace_setevent @TraceID, 59, 22, @on;   -- ObjectID
EXEC sp_trace_setevent @TraceID, 59, 32, @on;   -- Mode
EXEC sp_trace_setevent @TraceID, 59, 35, @on;   -- DatabaseName
EXEC sp_trace_setevent @TraceID, 59, 57, @on;   -- Type


-- Set the Filters
-- Set the trace status to start
EXEC sp_trace_setstatus @TraceID, 1;

-- display trace id for future references
SELECT TraceID=@TraceID;
GOTO finish;

error:
SELECT ErrorCode=@rc;

finish:
GO
From this script, you can see that the trace is collecting data from three events (Deadlock Graph (148), Lock:Deadlock (25) and Lock:Deadlock Chain (59)) and several columns for each event. The next step is to convert all of this information into XE events / actions. For this, I’ll modify the script in BOL (at https://msdn.microsoft.com/en-us/library/ff878264.aspx) to the following to return the XE events / actions for a specified running trace. Since the trace needs to be running, execute the above trace script to start the trace, then run the following code:
-- change the following value to the trace_id for the running trace to be converted to XE
DECLARE @trace_id INTEGER = 2;

SELECT DISTINCT
        tb.trace_event_id,
        te.name AS 'Event Class',
        em.package_name AS 'Package',
        em.xe_event_name AS 'XEvent Name',
        tb.trace_column_id,
        tc.name AS 'SQL Trace Column',
        am.xe_action_name AS 'Extended Events action'
FROM    sys.fn_trace_geteventinfo(@trace_id) ei
        JOIN sys.trace_events te
            ON te.trace_event_id = ei.eventid
        JOIN sys.trace_columns tc  -- all available trace columns
            ON tc.trace_column_id = ei.columnid
        LEFT OUTER JOIN sys.trace_xe_event_map em
            ON em.trace_event_id = te.trace_event_id
        LEFT OUTER JOIN sys.trace_event_bindings tb
            ON tb.trace_event_id = em.trace_event_id
            AND tc.trace_column_id = tb.trace_column_id
        LEFT OUTER JOIN sys.trace_xe_action_map am
            ON am.trace_column_id = tc.trace_column_id
ORDER BY tb.trace_event_id, tb.trace_column_id;
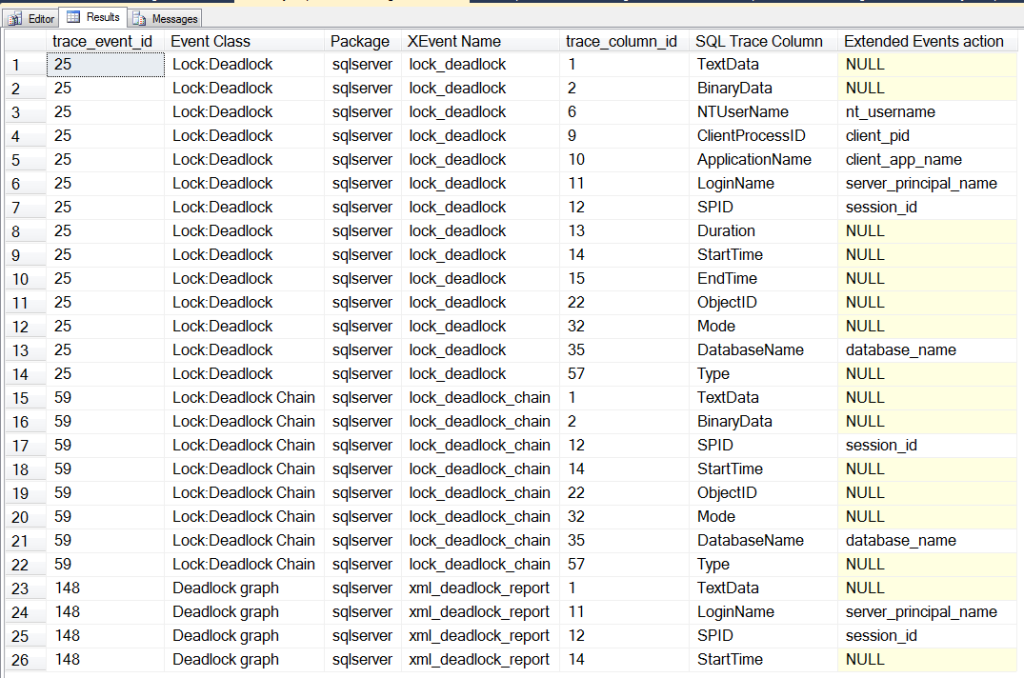
These results may contain NULL values in the “Extended Events action” column. A NULL value here means that there is not a corresponding event action for that column. For my deadlock trace, I get the following results:
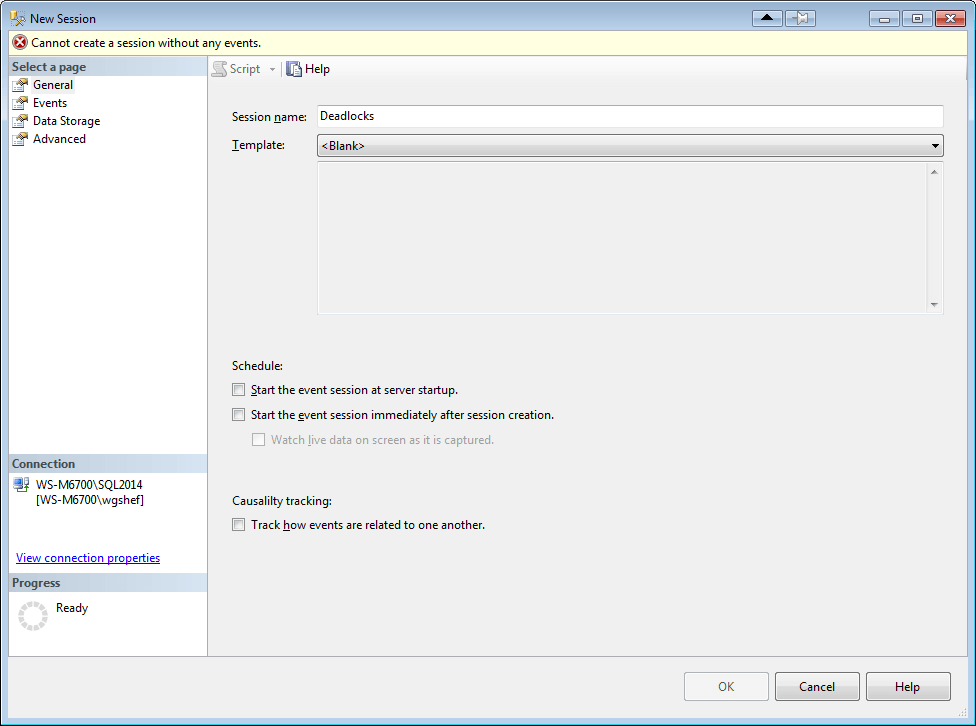
With this information, I can now jump into SSMS (2014) and use the New Session wizard to create a new XE session (Expand the Management and Extended Events nodes. Right click on Sessions and select New Session). I name the session “Deadlocks”, and click the “Events” page to select the events that I want to use.
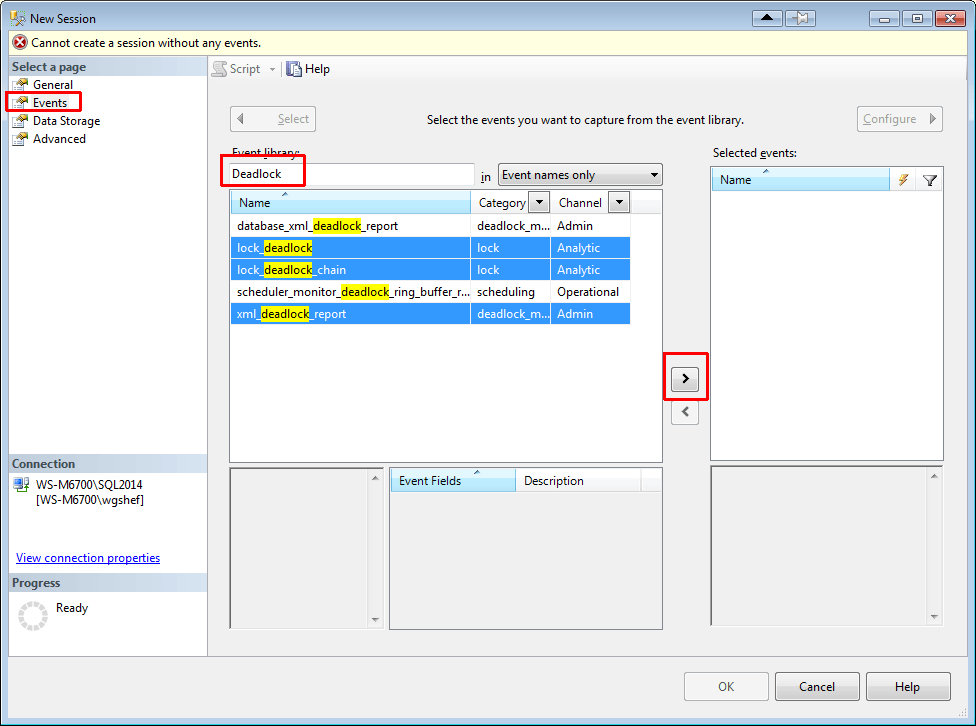
Since all of the events that I’m looking for contain “Deadlock”, I search for this and 5 events are displayed. I double-click each of the three listed above (or select them and click the “>” button) to move them to the “Selected Events” grid.
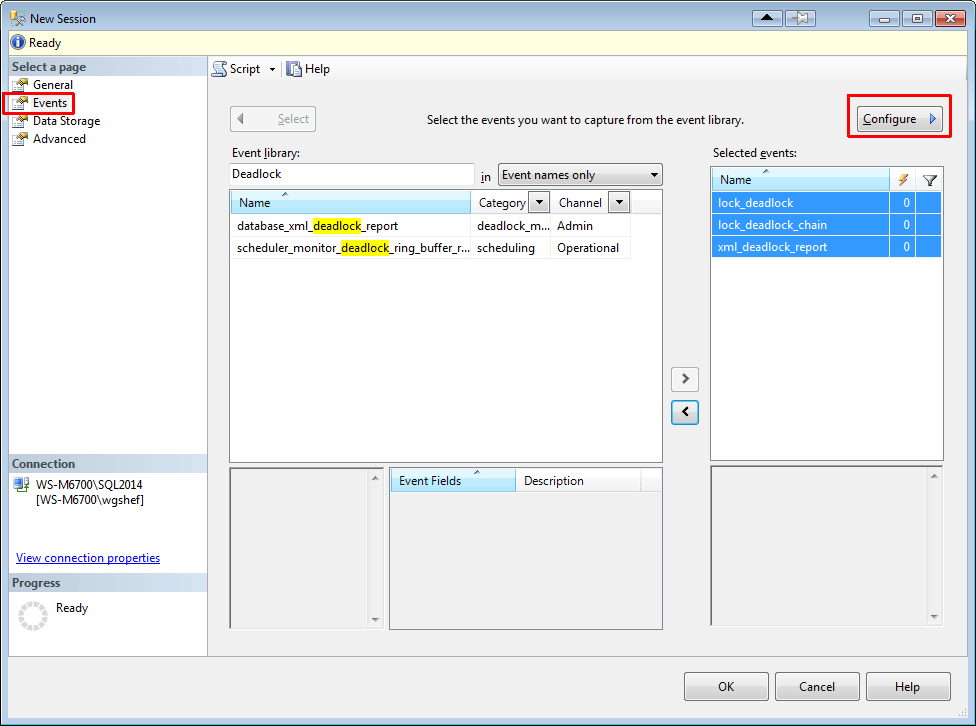
The next step is to configure the columns, so click the Configure button.
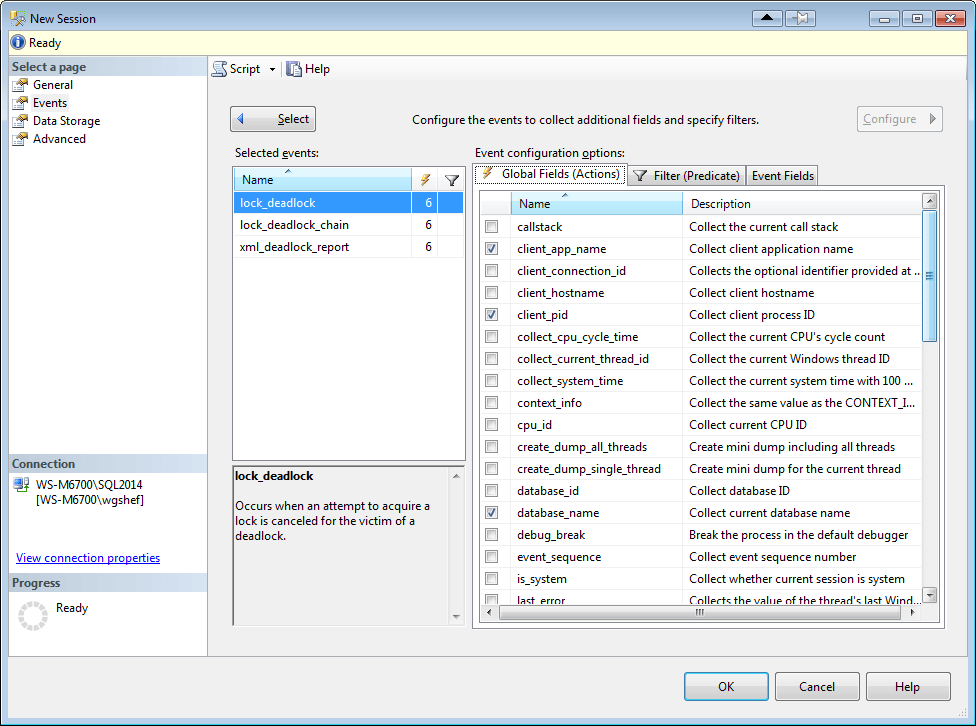
Select the lock_deadlock event, and on the “Global Fields (Actions)” tab select the client_app_name, client_pid, database_name, nt_username, server_principal_name and session_id columns.
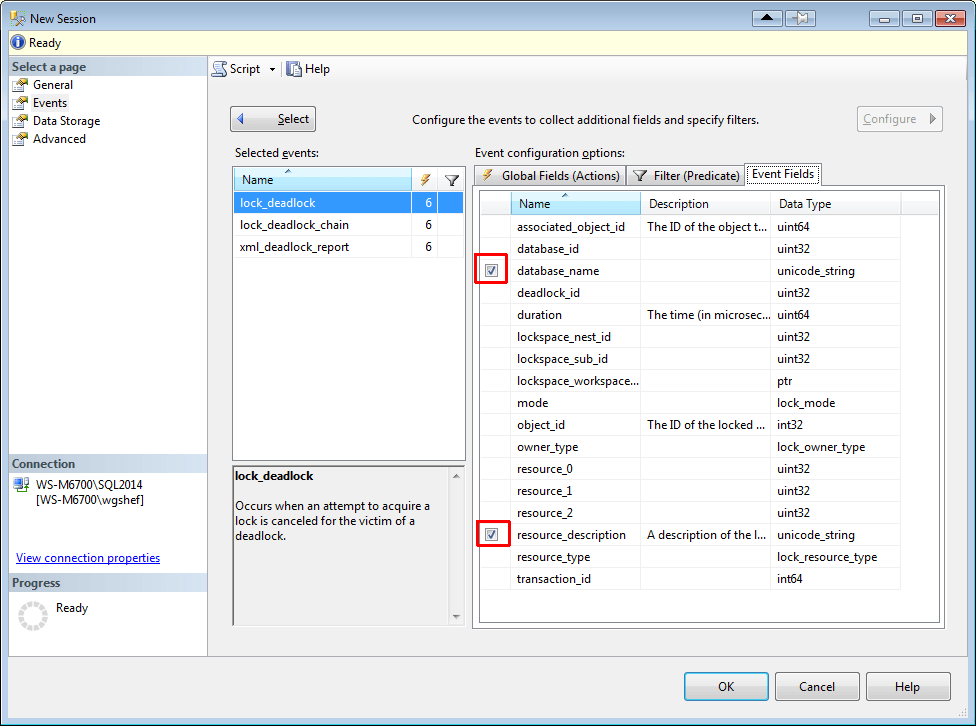
Click on the “Event Fields” tab, and check the checkboxes for database_name and resource_description. Fields that show up in this tab with checkboxes have customizable actions, and don’t actually collect the information unless checked. Frequently this will be because these fields require an additional level of resource usage to gather this information.
Select the lock_deadlock_chain event, and select the session_id and database_name columns on the “Global Fields (Actions)” tab. Click on the “Event Fields” tab and check the checkbox for database_name and resource_description. Finally, select the xml_deadlock_report event, and select the server_principal_name and session_id columns on the “Global Fields (Actions)” tab.
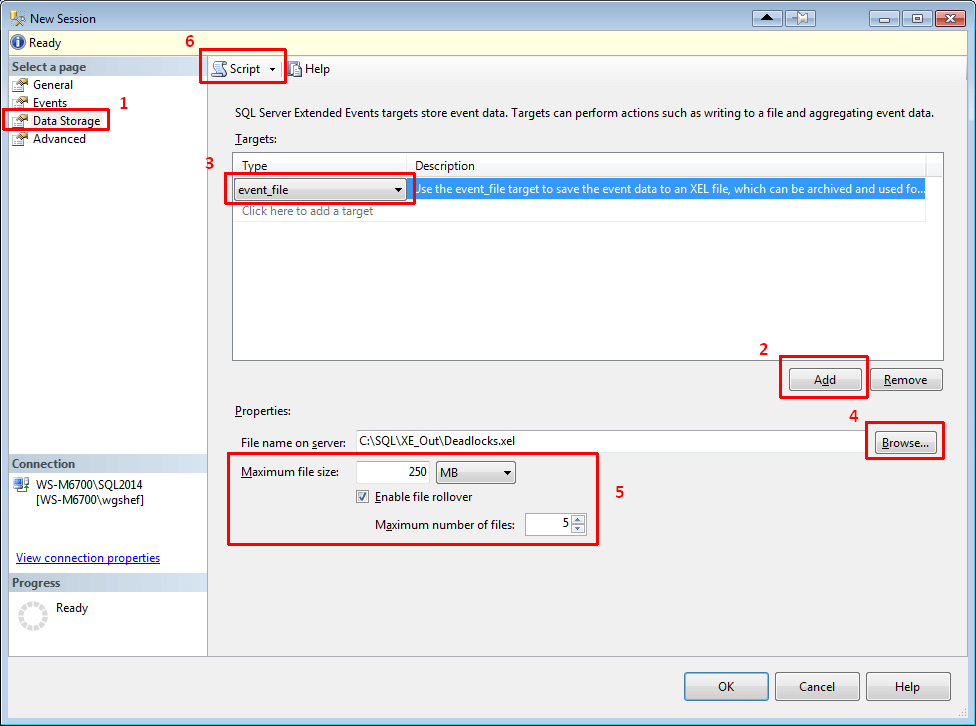
Finally, click on the Data Storage page, and add an event_file target type. The file name defaults to the name that you gave the session earlier. I set the maximum size to 250mb and 5 rollover files. If you select to script to a new query window (HIGHLY recommended), you will have a script with all of the DDL necessary to create this XE.
At this point, there are two changes that I like to make. First, I like to make my scripts so that they won’t have an error, and if the XE session already exists then one will be generated. To make it bullet-proof, I add an IF EXISTS check at the top and drop the XE session if it already exists. Secondly, I like to call xp_create_subdir to create the directory that the script points to, just in case the directory doesn’t exist. Note that xp_create_subdir will be successful if the directory already exists, so I don’t check to ensure that the directory doesn’t exist before executing this procedure.
My final XE Deadlock script looks like:
IF EXISTS (SELECT 1 FROM sys.server_event_sessions WHERE name = 'Deadlocks')
DROP EVENT SESSION [Deadlocks] ON SERVER;
GO
EXECUTE xp_create_subdir 'C:\SQL\XE_Out';
GO
CREATE EVENT SESSION [Deadlocks]
ON SERVER
ADD EVENT sqlserver.lock_deadlock(
    SET collect_database_name=(1),collect_resource_description=(1)
ACTION
(
  sqlserver.client_app_name-- ApplicationName from SQLTrace
, sqlserver.client_pid-- ClientProcessID from SQLTrace
, sqlserver.nt_username-- NTUserName from SQLTrace
, sqlserver.server_principal_name-- LoginName from SQLTrace
, sqlserver.session_id-- SPID from SQLTrace
)
),
ADD EVENT sqlserver.lock_deadlock_chain(
    SET collect_database_name=(1),collect_resource_description=(1)
ACTION
(
  sqlserver.session_id-- SPID from SQLTrace
)
),
ADD EVENT sqlserver.xml_deadlock_report(
ACTION
(
  sqlserver.server_principal_name-- LoginName from SQLTrace
, sqlserver.session_id-- SPID from SQLTrace
)
)
ADD TARGET package0.event_file
(
SET filename = 'C:\SQL\XE_Out\Deadlocks.xel',
max_file_size = 250,
max_rollover_files = 5
)
WITH (STARTUP_STATE=OFF)
;
Now that you have this XE session scripted out, it can be easily installed on multiple servers. If you encounter a deadlock problem, you can easily start the XE session and let it run to trap your deadlocks. They will be persisted to a file dedicated for the deadlocks. You can use my Deadlock Shredder script at http://bit.ly/ShredDL to read the deadlocks from the file and shred the deadlock XML into a tabular output.
Note that the default system_health XE session also captures deadlocks. I like to have a dedicated session for just deadlocks. As lightweight as XE is, sometimes it may benefit a server to turn off the system_health session. Additionally, Jonathan Kehayias has a script that will take a running trace and completely script out an XE session for it. This script can be found at https://www.sqlskills.com/blogs/jonathan/converting-sql-trace-to-extended-events-in-sql-server-2012/. Even though this script is available, I like to figure things out for myself so that I can learn what is actually going on.
Did you catch the note above where I mentioned that the default system_health XE captures deadlocks? This means that if you are still enabling trace flags 1204 and/or 1222 to capture deadlock information in your error logs, you don’t need to do that anymore. Furthermore, by using this Deadlock XE, you can have the deadlocks persisted to a file where, in combination with my Deadlock Shredder script, it will be even easier to analyze the deadlocks than trying to figure it out from the captured information in the error logs.
I hope that this post will help someone with the conversion from using SQL Profiler to using XE instead. The process for converting other traces would be the same, so it can be easily adapted. I also hope that these deadlock scripts will be helpful to you!
In my next post, I will be comparing the results of the deadlock trace and the deadlock XE session.
And Jes – thanks for hosting this month! I’m really looking forward to seeing the roundup for this month.
This post is re-published from my original post on SQL Solutions Group.
The post Weaning yourself off of SQL Profiler (Part 1) appeared first on Wayne Sheffield.


