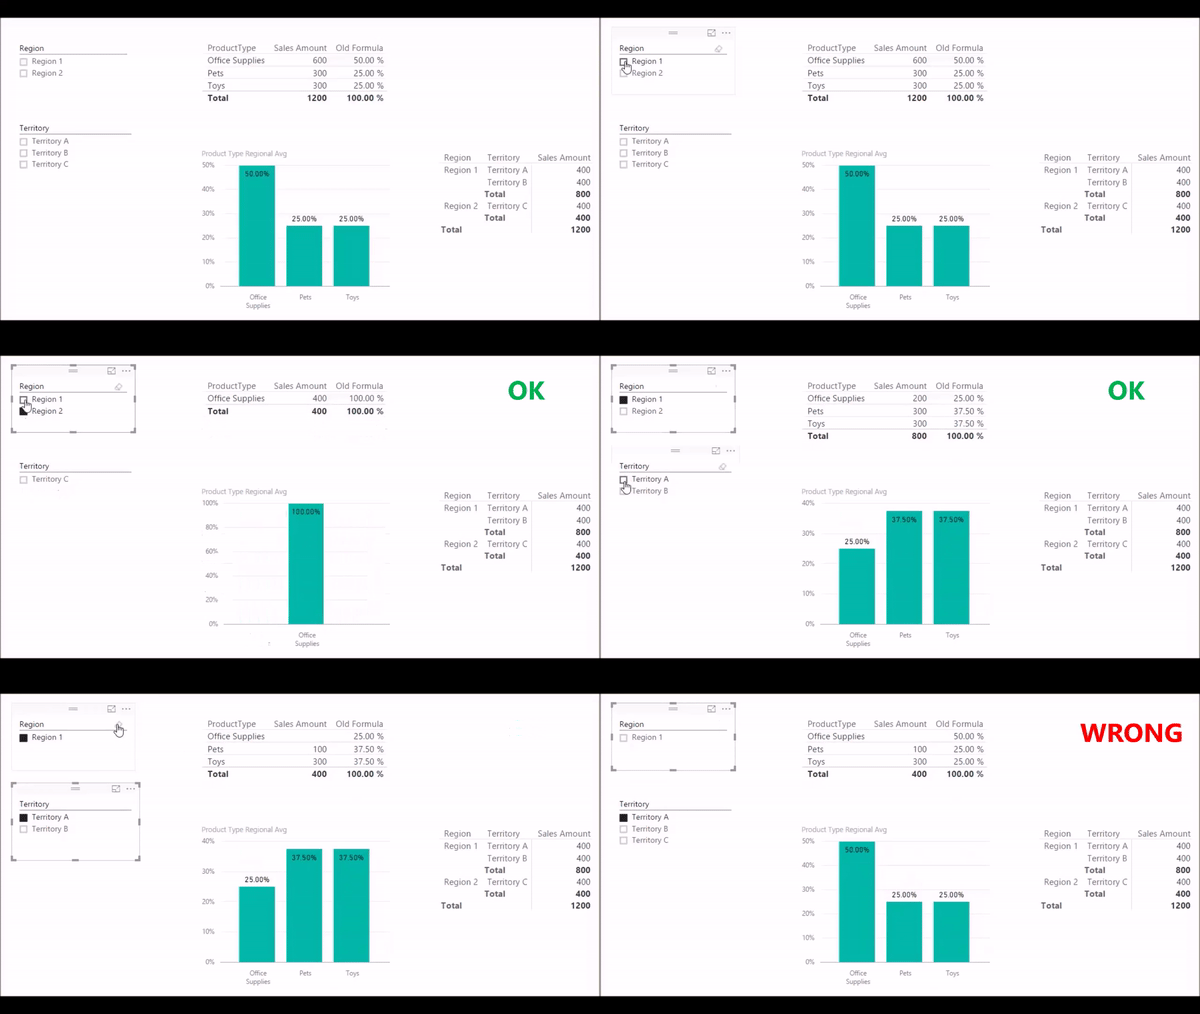
My friend and coworker Melissa Coates (aka @sqlchick) messaged me the other day to see if I could help with a DAX formula. She had a Power BI dashboard in which she needed a very particular interaction to occur. She had slicers for geographic attributes such as Region and Territory, in addition to a chart that showed the percent of the regional total that each product type represented. The product type was in the fact/data table. Region and territory were in a dimension/lookup table and formed a hierarchy where a region was made up of one or more territories and each territory had only one region.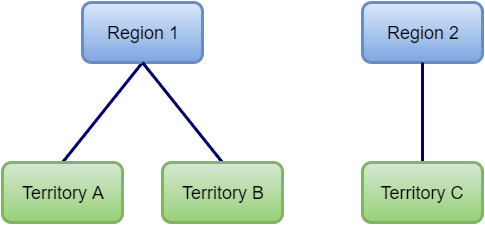
The requirement was that if a user selected no regions and one territory, the chart should show the % contribution of each product type for the region in which the territory is located.
Back in the MDX days this would be easy because we could go up the hierarchy (assuming the hierarchy is called Geography) using something like [Geography].[Geography].CurrentMember.Parentor Ancestors([Geography].[Geography].CurrentMember,1).
DAX doesn’t have this same capability, so you have to approach it a bit differently.
I made a quick demo model to mimic the circumstances.
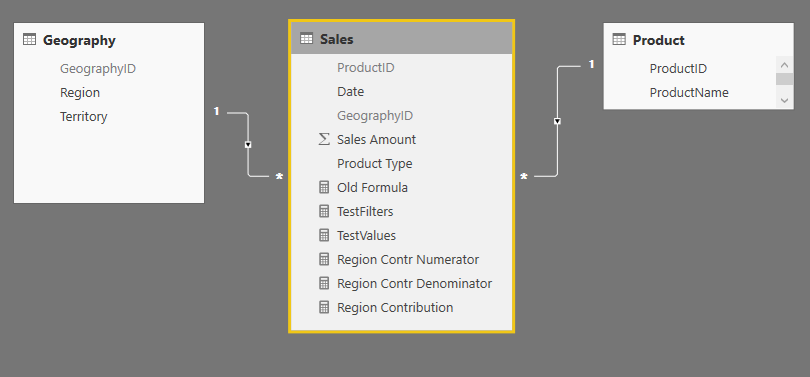
- The Geography table contains an ID as well as Region and Territory.
- The Product table contains and ID and Product Name.
- The Product Type is actually in the fact/data table along with the Sales Amount.
- The relationships between the tables are many:1 from the Sales table to the lookup tables, both with cross filter direction set to single.
The ultimate calculation we wanted was <regional product type sales amount> / <region sales amount total for all product types>.
The initial calculation we started with was:
Percent Of Region Total :=
CALCULATE (
 SUM ( 'Sales'[Sales Amount] ),
 ALLSELECTED ( 'Geography'[Region] ),
 ALL ( 'Geography'[Territory] )
)
 / CALCULATE (
 SUM ( 'Sales'[Sales Amount] ),
 ALL ( 'Sales'[Product Type] ),
 ALLSELECTED ( 'Geography'[Region] ),
 ALL ( 'Geography'[Territory] )
 )
Notice that the numerator and denominator are the same, except the denominator overrides the query context for Product Type. This calculation worked fine when a single region was selected and no territories were selected. Once a territory is selected, it limits the scope to just that territory rather than the entire region, which is not desired.
In order to make sure I understood the query and filter context, I added two calculated measures:
TestFilters := IF ( HASONEFILTER ( 'Geography'[Region] ), "1", "Many" )
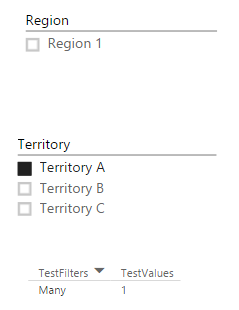
TestValues:= IF (HASONEVALUE('Geography'[Region] ), "1", "Many" )
I put these measures in a pivot table along with my product types and my geography slicers, and I selected no regions and one territory. The TestFilters measure returned “Many”, but the TestValues measure returned “1”. So I had my first clue as to how to find my desired region.
Next I worked on my numerator in my final calculation. I knew my measure would include the sum of Sales Amount, so I started with that and added CALCULATE() to it in order to change the context. I needed to remove the territory context so I started with Calculate(Sum('Sales'[Sales Amount]), ALL('Geography'[Territory]))
Then I needed to group those results by region and filter to only the desired region, which I did using MAXX(VALUES(Geography[Region])). If I selected a single region or a single territory, I would only get one region back in the values. MAXX() was used to retrieve a single result rather than a table. My numerator ended up as:
Region Contr Numerator :=
MAXX (
VALUES ( Geography[Region] ),
CALCULATE ( SUM ( Sales[Sales Amount] ), ALL ( Geography[Territory] ) )
)
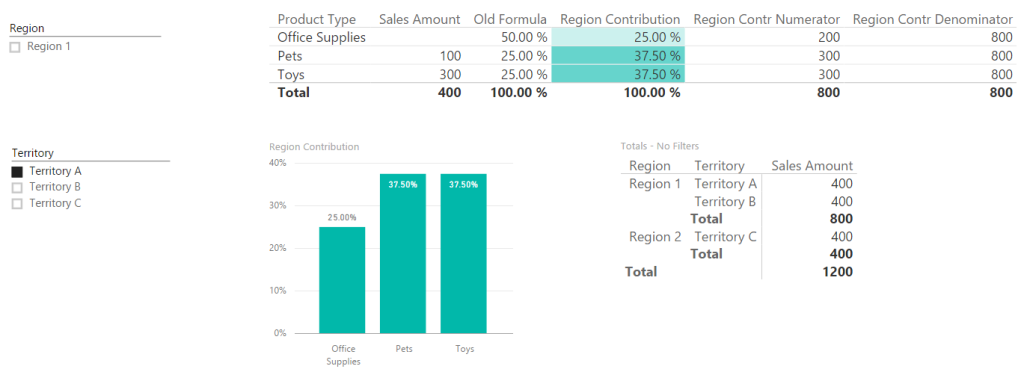
This way, the context of the region corresponding to the selected territory is saved outside of the CALCULATE() in the VALUES(‘Geography'[Region]), but it was removed inside the CALCULATE() to provide the region total. This formula works when no territories and one region is selected as well as when no regions and one territory is selected.
The denominator is written similarly with the addition of the ALL(‘Product'[ProductType]) filter inside of the CALCULATE().
Region Contr Denominator =
MAXX (
VALUES ( Geography[Region] ),
CALCULATE (
SUM ( Sales[Sales Amount] ),
ALL ( 'Sales'[Product Type] ),
ALL ( Geography[Territory] )
)
)
To finish up, I created my final calculation and added a bit of error handling for cases when no regions or territories are selected:
Region Avg =
IF (
HASONEVALUE ( 'Geography'[Region] ),
DIVIDE ( [Region Contr Numerator], [Region Contr Denominator] ),
BLANK ()
)
These calculations provided the desired result.
Note that this only works with the cross filter direction set to single in the relationships. Also, originally I had a Product Type attribute in my Product table, used DAX to add it to my Sales table (to replicate the situation we were solving for) , and then forgot and put the Product Type from Product in my visuals. This clearly didn’t work because I didn’t set my context in the calculations using the field from the Product table.
Hopefully this will come in handy if you have some interesting filter/slicer requirements in your reports.


