Another post for me that is simple and hopefully serves as an example for people trying to get blogging as #SQLNewBloggers.
In the last post on Window functions, I looked at ROW_NUMBER, and how I can use this to order rows. In this one, I want to look at one of the advantages of Window functions in trying to combine data and aggregates together.
A Scenario
In the last post, I examined the career of Ken Griffey, Jr., showing his home runs with some ordering. That wasn’t a very realistic case of using data, so let’s look at another one. Suppose I want to know the percentage of his career home runs he hit during each one of his seasons. That’s an interesting question, showing some idea of how much he improved or declined. If I try a to start combining a “normal” aggregate with other data, I can’t do it without a GROUP BY.
Not a huge big deal, as I can put the sum in a CTE and use it later. Here’s the code:
WITH cteHR (PlayerID, TotalHR)
AS (   SELECT
                 b.playerID
               , SUM (hr)
        FROM     dbo.batting AS b
        WHERE    b.playerID = 'griffke02'
        GROUP BY b.playerID)
SELECT
                b.yearID
              , b.teamID
              , hr
              , TotalHR
              , ROUND((hr * 1.0) / TotalHR * 100, 2) AS percentofCareer
FROM
                dbo.batting AS b
     INNER JOIN cteHR
         ON cteHR.PlayerID = b.playerID
WHERE          b.playerID = 'griffke02'
ORDER BY       b.yearID;
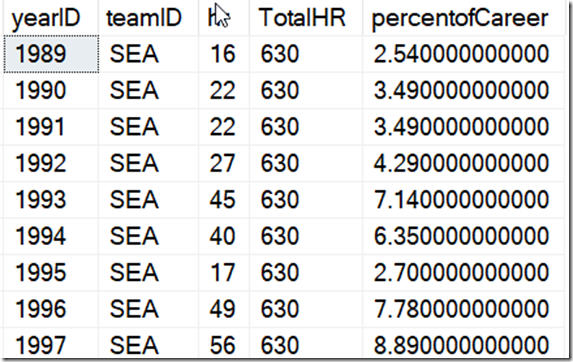
And the results.
That’s OK, but the code is complex, and if I wanted to break the home runs by team or some other group, it would get more complex quickly.
Window Functions Simplify Things
Here’s a simpler query. I’ve just added the SUM with an OVER() clause, without any order. I just want all rows summed. I added this to the query to see the value.
SELECT
          b.yearID
        , TeamID
        , HR
        , SUM (b.hr) OVER (ORDER BY (SELECT NULL)) AS TotalHR
        , ROUND ((b.HR * 1.0) / SUM (b.hr) OVER (ORDER BY (SELECT NULL))  * 100, 2) AS TeamPercentofCareer
FROM     dbo.batting AS b
WHERE    b.playerID = 'griffke02'
ORDER BY b.yearID;
The results are the same as the other query, but it’s easy to see.
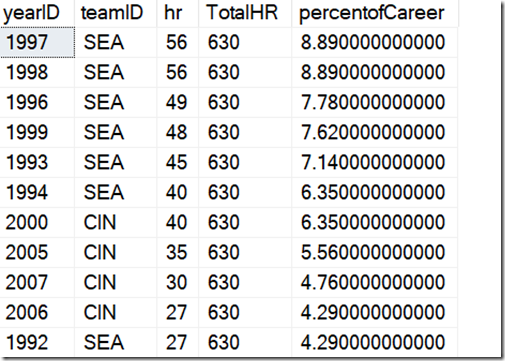
What if I wanted to change this and order this by the highest percentage years of his career. In other words, when was he the most productive. I can easily add an ORDER BY to both queries to see this, but I lose some context.
Look at these results. How do I know if 1997 was closed to the beginning or end of his career?
I want to add some context with the span of his career. I can do that easily with a few more Window functions. Here’s the result I want, with the years showing his career first. I moved some of the other data to the end.
Without window functions, this would be complex, as the MIN() and MAX() would be from different columns, so I’d need another CTE. Here, I can use this code:
SELECT
        CAST(MIN (b.yearID) OVER (ORDER BY (SELECT NULL)) AS CHAR(4))
        + '-'
        + CAST(MAX (b.yearID) OVER (ORDER BY (SELECT NULL)) AS CHAR(4)) AS CareerSpan
        , b.yearID
        , ROUND ((b.HR * 1.0) / SUM (b.hr) OVER (ORDER BY (SELECT NULL))  * 100, 2) AS TeamPercentofCareer
        , TeamID
        , HR
        , SUM (b.hr) OVER (ORDER BY (SELECT NULL)) AS TotalHR
FROM     dbo.batting AS b
WHERE    b.playerID = 'griffke02'
ORDER BY TeamPercentofCareer desc;
If I wanted to add some math, like how many years into his career was he, I could easily do that. Here I’ve added the year number to his career, which comes from ROW_NUMBER().
The code? I just add the aggregates I need, which in this case are ones containing the entire set. I mix MIN(), MAX(), COUNT() and ROW_NUMBER(), and use a partition of the entire data set.
SELECT
        CAST(MIN (b.yearID) OVER (ORDER BY (SELECT NULL)) AS CHAR(4))
        + '-'
        + CAST(MAX (b.yearID) OVER (ORDER BY (SELECT NULL)) AS CHAR(4)) AS CareerSpan
        , b.yearID
        , ROUND ((b.HR * 1.0) / SUM (b.hr) OVER (ORDER BY (SELECT NULL))  * 100, 2) AS TeamPercentofCareer
        , RTRIM(CAST(ROW_NUMBER() OVER(ORDER BY (SELECT NULL)) AS CHAR(2)) )
        + ' of '
        + CAST( COUNT(yearid) OVER(ORDER BY (SELECT NULL)) AS CHAR(2))
        AS YearInCareer
        , TeamID
        , HR
        , SUM (b.hr) OVER (ORDER BY (SELECT NULL)) AS TotalHR
FROM     dbo.batting AS b
WHERE    b.playerID = 'griffke02'
ORDER BY TeamPercentofCareer desc;
Try doing that without window functions. It’s a nightmare to write in T-SQL.
SQLNewBlogger
This was pretty easy to write. The hard part was thinking of the questions I might ask of this data set and setting up the queries. Duplicating this without window functions was fun, and took more time. But it was good practice for me, and helped me to better understand why I like window functions.
This took me about 30 minutes, and it’s a good showcase of learning a new technique and applying it. You should do this if writing reports and aggregates is part of your job and you might want to showcase this to your next potential employer.


