What is it about 4:45 pm on a Friday afternoon that makes CPUs spike, drives crash, databases corrupt? I wish I knew but I don’t. I do know that I have been on the receiving end a few times. Just shutting down the last applications when a call or a page comes in. Next minute you’re phoning home and dinner’s in the warmer.
On one such Friday afternoon, in the not too distant past, one of the DBA team noticed that CPU was running hot on our main production server. I could see from looking at task manager on the server that the SQL process was responsible for the CPU usage. But this is a busy OLTP production server and I needed to isolate the process or processes responsible. Looking at sys.sysprocesses it wasn’t immediately obvious what session could be responsible.
Next step was to run process explorer on the server to narrow down which CPU’s were spiking. If you haven’t already discovered it, process explorer is a great free lightweight diagnostic tool from the sys internals team. The executable can be downloaded and run without any installation.
http://technet.microsoft.com/en-us/sysinternals/bb896653.aspx
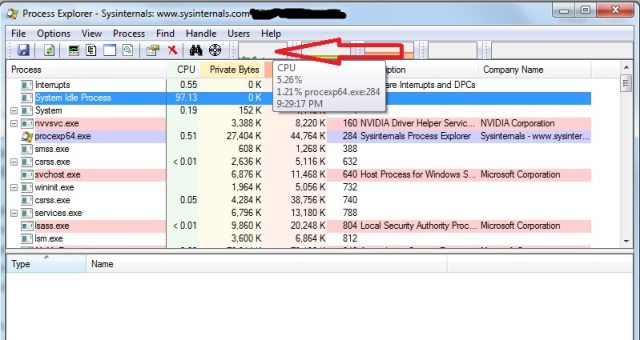
Open process explorer and click on one of the small graphs near the top to get a detailed view.
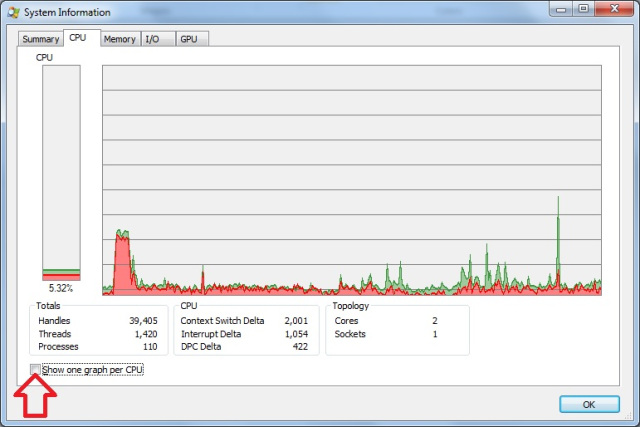
Tick the “Show one graph per CPU” option.
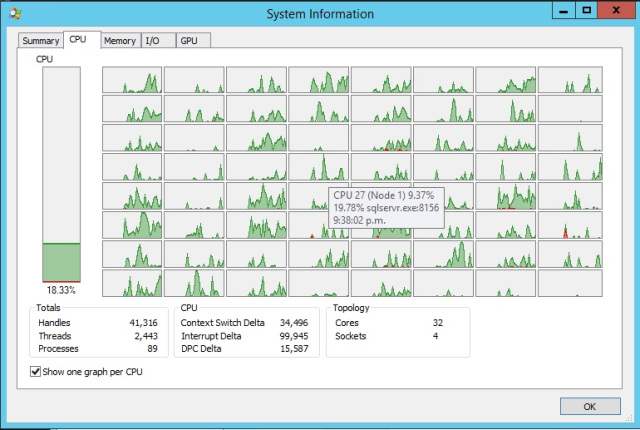
Hovering over the individual graphs will give the CPU id.
Note: The screenshots above are not from the actual issue. At the time I was too busy trying to fix the problem to take screenshots for later use 
Using process explorer this way I found that CPU usage was jumping up and down but there were two CPUs that were sitting at 100% consistently. Armed with the ids I hit SQL Server and some DMVs.
Using sys.dm_os_schedulers with the ids of the two rogue CPUs gave me the scheduler addresses.
select scheduler_address from sys.dm_os_schedulers
where cpu_id in
([id1],[id2])
Putting the scheduler addresses into sys.dm_os_workers gave me task addresses.
select task_address from sys.dm_os_workers
where scheduler_address in
([scheduler_address_1]
,[scheduler_address_2])
And finally putting the task addresses into sys.dm_os_tasks gave me the session ids.
select session_id from sys.dm_os_tasks
where task_address in
([task_address_1]
,[task_address_2])
Or if you want to put it all together you get something like.
select
s.cpu_id,
w.[state],
t.session_id
from sys.dm_os_schedulers s
left join sys.dm_os_workers w
on s.scheduler_address = w.scheduler_address
left join sys.dm_os_tasks t
on w.task_address = t.task_address
where s.cpu_id in ([id1],[id2],...)
and w.[state] = 'RUNNING'
There’s a bunch of other columns that you might be interested in from these DMVs – but in my case I just wanted the session ids.
From there I could go back to sys.sysprocesses and see that in this case it was a system service broker process that was pegging the CPU. Restarting the service broker queue cleared the issue instantly.
ALTER QUEUE [my_queue]
WITH STATUS=OFF

ALTER QUEUE [my_queue]
WITH STATUS=ON


