SQL Server has plenty of reports. Reports extended more with the occurrence of the SQL Server 2012 version.
SQL folks in general, usually don’t take them as handy, or maybe are not aware of them enough. But the reports are really useful. I use them as much as possible, even though I sometimes search the web for some scripts to find some information. However, I also see and know that many people just search the web or ask on the forums when they need to find something. The web is full of various scripts which sometimes could not be the right choice for your needs. Hence, I recommend on using the SQL Server reports.
This is the standard list of in-built reports with every SQL Server 2012+ installation:
Disk Usage. This report provides detailed data on the utilization of disk space by top 1000 tables within the Database. The report does not provide data for memory optimized tables.
Disk Usage by Top Tables. Report provides detailed data on the utilization of disk space by top 1000 tables within the Database. The report does not provide data for memory optimized tables.
Disk Usage by Table. The report provides detailed data on the utilization of disk space by top 1000 tables within the Database. Report does not provide data for memory optimized tables.
Disk Usage by Partition. This report provides detailed data on the utilization of disk space by index and by partitions within the Database. The report does not provide data for memory optimized tables.
Backup and Restore Events. This report provides historical data about Backup and Restore actions performed on the Database.
All Transactions. Report provides details on all of the currently open user transactions within a Database.
All Blocking Transactions. This report identifies transactions within the Database that are blocking other transactions and provides details about them.
Top Transactions by Age. Report identifies the oldest user transactions in the Database.
Top Transactions by Blocked Transactions Count. Report identifies the transactions within the Database which are blocking the highest number of other transactions.
Top Transactions by Locks Count. This report identifies the transactions within the Database which have obtained the most significant locks.
Resource Locking Statistics by Objects. The report enumerates all objects within the Database on which locks have been acquired and provides details on the kind of locks held and who is holding them.
Object Execution Statistics. This report provides detailed historical execution data for all currently cached plans for objects within the Database. This execution data is aggregated over the time during which the plan has been in the cache.
Database Consistency History. This report provides a history of executions of DBCC CHECKDB as captured by the Default Trace.
Memory Usage by Memory Optimized Objects. This report provides detailed data on the utilization of memory space by memory optimized objects within the Database
Index Usage Statistics. This is probably one of the most used report by users and it provides details on usage of individual Indexes within the Database as well as data on the cost of maintaining them. The report does not provide data for indexes on memory optimized tables.
Index Physical Statistics. This is probably one of the most used report by users and it provides details on fragmentation of indexes within the Database. The report does not provide data for columnstore indexes and indexes on memory optimized tables
Schema Changes History. This report provides a history of all committed DDL statement executions within the Database recorded by the default trace.
User Statistics. This report provides details on the activity of all currently connected users within the Database.
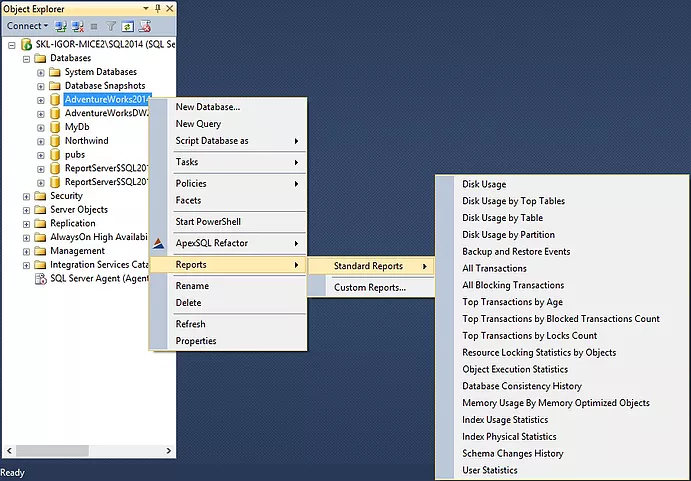
You can open them by Right clicking on a database -> Reports -> Standard reports and there you are. It’s shown on the figure below.

However, that’s not all what SQL Server offers for its reporting. There is an add-in Microsoft® SQL Server® 2012 Performance Dashboard Reports which you can download from this link – https://www.microsoft.com/en-us/download/details.aspx?id=29063.
Note: This works for SQL Server 2014 and onward too.
Then you need to follow the installation instructions and for short time you’ll enrich your reports portfolio with additional 21 reports.
After the easy installation, you should proceed with the steps given in the Readme file:
Getting Started With the Performance Dashboard Reports
1. Each SQL Server instance you plan to monitor must contain the procedures and functions used by the queries in the reports. Using SQL Server Management Studio (SSMS), open the setup.sql script from your installation directory (default of %ProgramFiles(x86)%Microsoft SQL Server110ToolsPerformance Dashboard) and run the script. Close the query window once it completes.
2. In the Object Explorer pane in SSMS, right mouse click on the SQL Server instance node, then choose Reports-Custom Reports. Browse to the installation directory and open the performance_dashboard_main.rdl file. Explore the health of your server by clicking on the various charts and hyperlinks in the report.
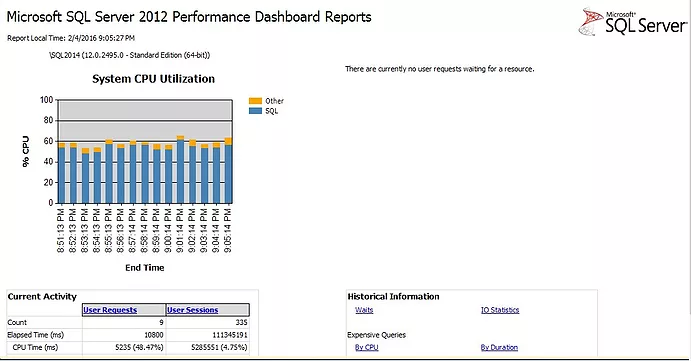
Here is the starting page of the dashboard_main with some charts and tables with links to other reports.

All of the remaining reports are accessed as drill through operations from the main page or one of its children. For a detailed explanation of all installation requirements and guidance on how to use the reports, please see the help file PerformanceDashboardHelp.chm


