Windows Performance Counter Alerts can be configured to be triggered on any Performance Monitor (Perfmon) Counter through the use of a User Defined Data Collector Set. However, if you wish to be notified via email when an Alert is triggered you have have to use a combination of Perfmon, Task Scheduler and good ol’ Powershell. If you follow the steps below you will be on your way to email alert nirvana.
Step 1 – Write a Powershell Script
The first thing that you need to do is write a Powershell script that when run can send an email. While researching this I discovered many ways to accomplish this task, so what I’m about to show you is just one way, but feel free to experiment and use what is right for your environment.
In my lab I do not run my own SMTP server, so I had to write a script that could leverage my Gmail account. You will see in my Powershell script the password to the email account that authenticates to the SMTP server is in plain text. If you are concerned that someone may have access to your script and discover your password then you will want to encrypt your credentials. Gmail requires and SSL connection so your password should be safe on the wire, just like any other email client.
Here is an example of a Powershell script that when used in conjunction with Task Scheduler and Perfmon can send an email alert automatically when any user defined performance counter threshold condition is met. In my environment I said this to C:\Alerts\Alerts.ps1
$counter = $Args[0]
$dtandtime = $Args[1]
$ctr_value = $Args[2]
$threshold = $Args[3]
$value = $Args[4]
$FileName="$env:ComputerName"
$EmailFrom = "sios@medfordband.com"
$EmailTo = "dave@medfordband.com"
$Subject ="Alert From $FileName"
$Body = "Data and Time of Alert: $dtandtime`nPerfmon Counter: $ctr_value`nThreshold Value: $threshold `nCurrent Value: $value"
$SMTPServer = "smtp.gmail.com"
$SMTPClient = New-Object Net.Mail.SmtpClient($SmtpServer, 587)
$SMTPClient.EnableSsl = $true
$SMTPClient.Credentials = New-Object System.Net.NetworkCredential("sios@medfordband.com", "ChangeMe123");
$SMTPClient.Send($EmailFrom, $EmailTo, $Subject, $Body)
An example of an email generated from that Powershell script looks like this.
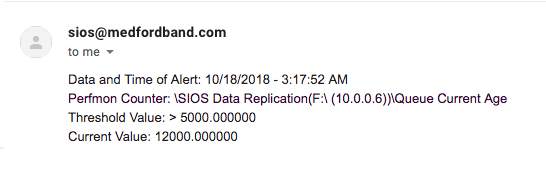
You probably noticed that this Powershell script takes four arguments and assigns them to variables used in the output. It also saves the computer name to a variable which is also used as part of the output. By doing this the script can be used to send an email on any Perfmon Alerting Counter and on any server without additional customization.
Step 2 – Set Up a Scheduled Task
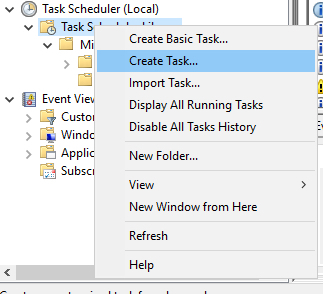
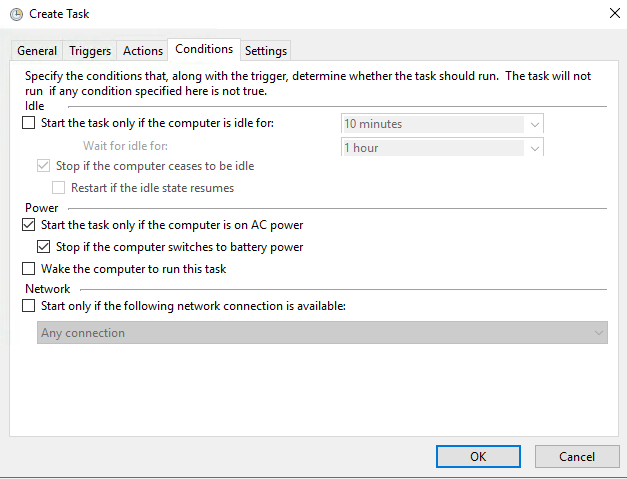
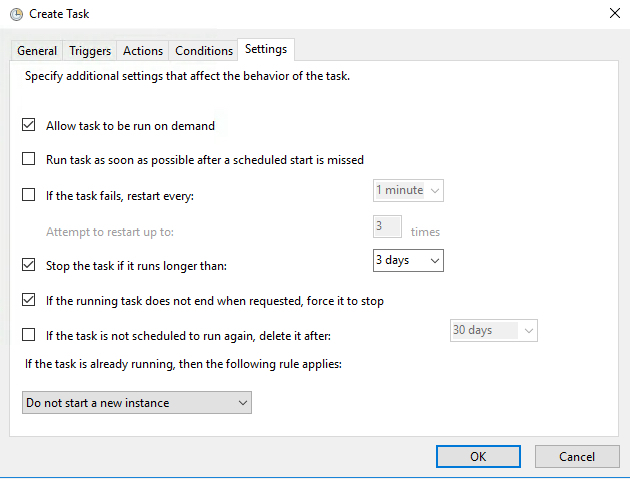
In Task Scheduler we are going to Create a new Task as show in the following screen shots.
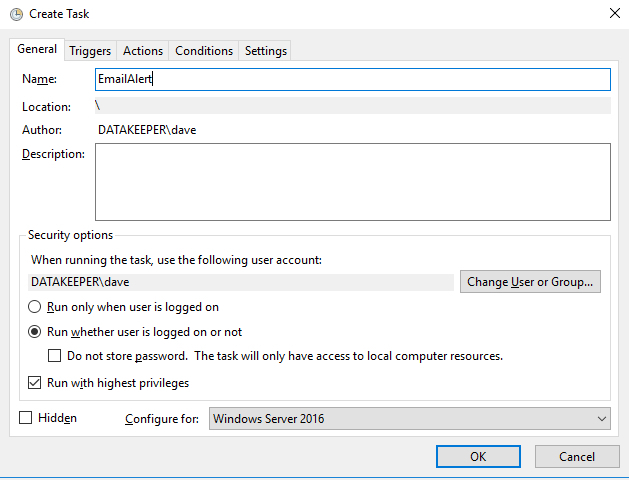
Give the Task a name, you will need to remember it for the next step.
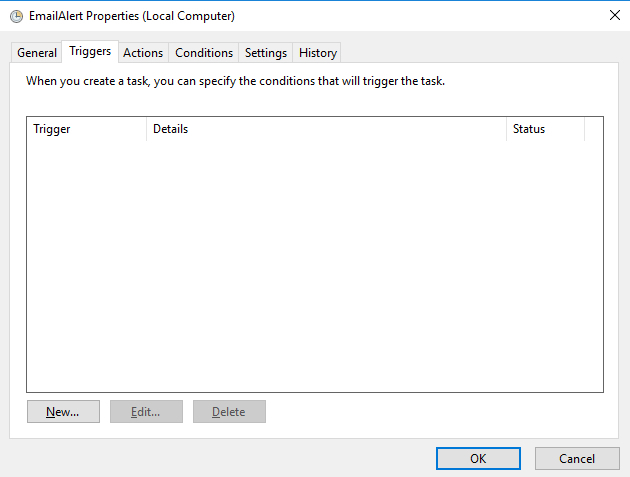
Notice that there are no Triggers. This Task will actually be triggered through the Perfmon Counter Alert we will set up in Step 3.
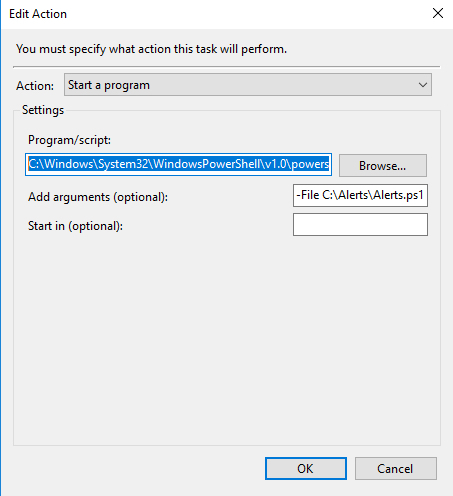
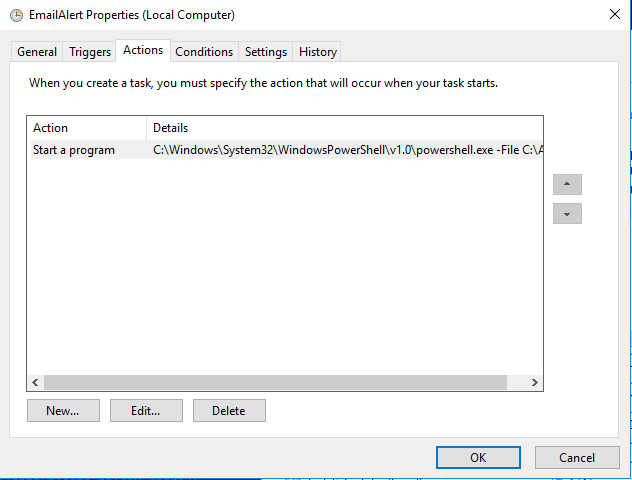
On the Action tab you want to define a new action. The action will be to Start a Program and use the following inputs, please adjust for your specific environment.
Program Script: C:\Windows\System32\WindowsPowerShell\v1.0\powershell.exe
Add Arguments: -File C:\Alerts\Alerts.ps1 $(Arg0)
Step 3 – Create the Perfmon Counter Alert
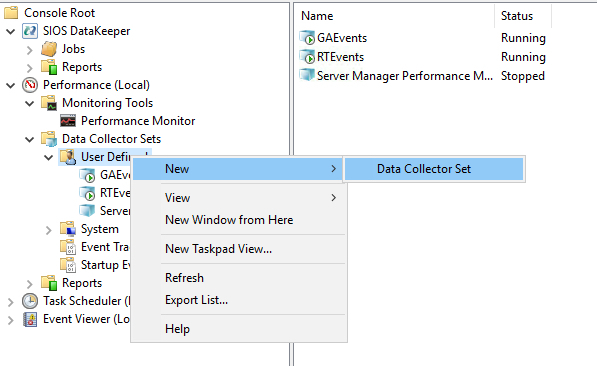
Create a new Data Collector Set
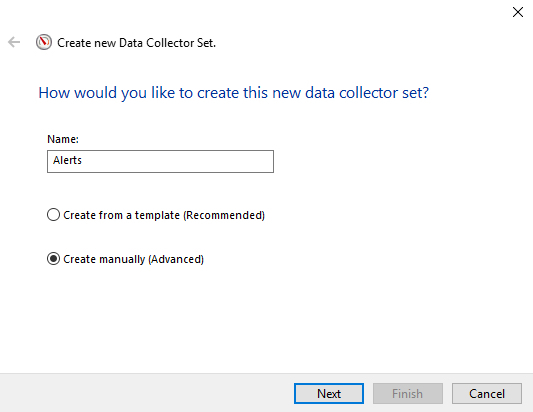
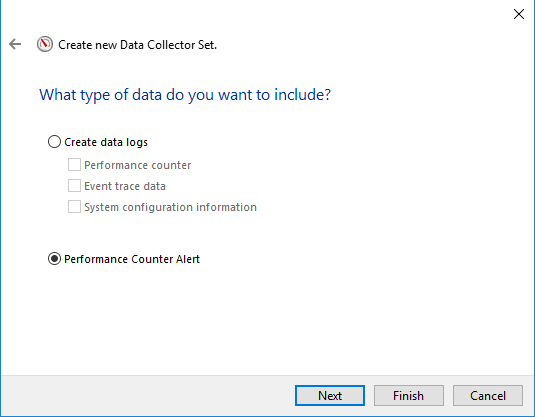
Add whichever Performance Counters you would like to monitor and set the Alerting threshold.
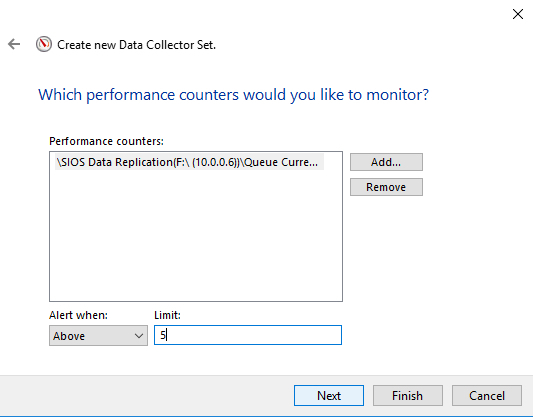
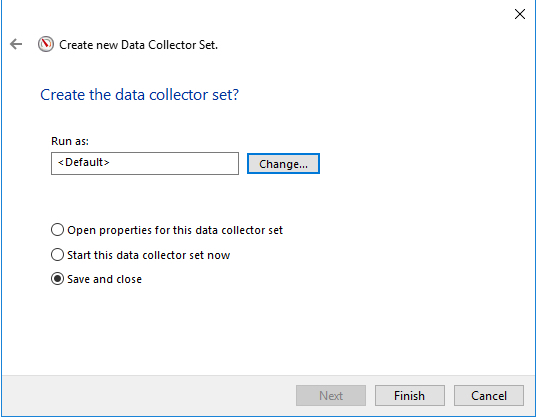
Once you have created the Data Collector Set go into the Properties of it and make sure the Alerting threshold and Sample Interval is set properly for each Performance Counter. Keep in mind, if you sample every 10 seconds then you should expect to receive an email every 10 seconds as long as the performance counter exceeds the threshold you set.
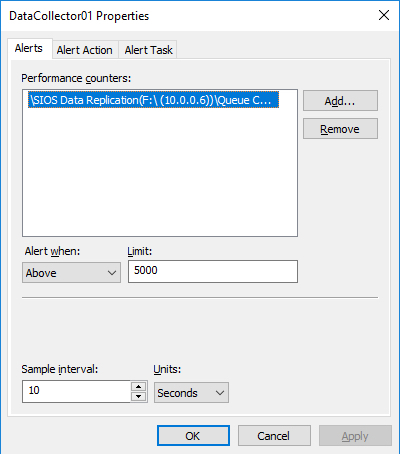
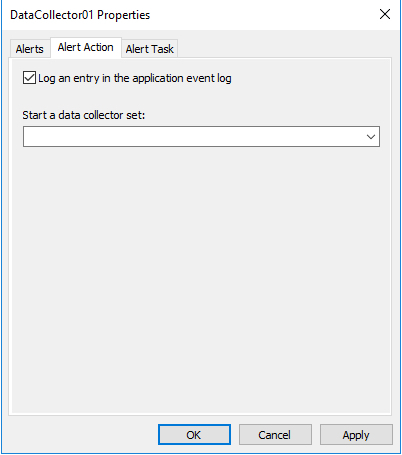
If you select the Log an entry in the application event log don’t expect to see any entries in the normal Application event log. It will be written to the Microsoft-Windows-Diagnosis-PLA/Operational log in the Application and Services log directory.
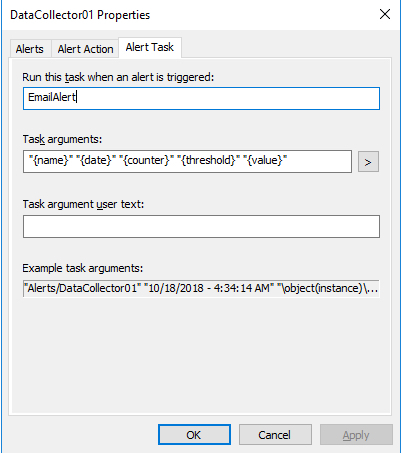
And then finally we have to set an Alert Task that will trigger the Scheduled Task (EmailAlert) that we created in Step 2. You see that we also pass some of the Task arguments which are used by the Powershell script to customize the email with the exact error condition associated with the Alert.
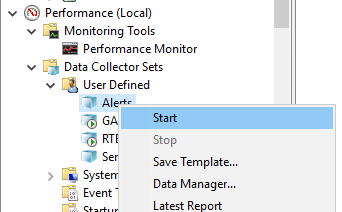
Once the Data Collector is configured properly you will want to start it.
If you configured everything correctly you should start seeing emails any time an alert threshold is met.
If it doesn’t seem to be working, check the following…
- Run the Powershell script manually to make sure it works. You may need to manually set some of the variables for testing purposes. In my case it took a little tweaking to get the Powershell script to work properly, so start with that.
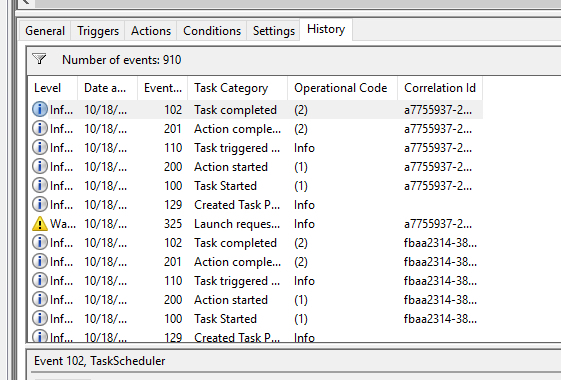
- Check the Task History to make sure the Alert Counter is triggering the Task.

- Run the Task manually and see if it triggers the Powershell.
Step 4 – Set the Perfmon Counter to Run Automatically
You might think you were done, but you have one more step. Whenever you reboot a server the Perfmon Counter Alert will not start automatically. In order to survive a reboot you must run the following at a command prompt. Note “Alerts” referenced in the script below is the name of my user defined Data Collector Set.
schtasks /create /tn Alerts /sc onstart /tr "logman start Alerts" /ru system
There are a few edge cases where you might have to create another Trigger to start the Data Collector set. For example, SIOS DataKeeper Perfmon Counters only collects data from the Source of the mirror. If you try to start the Data Collection Set on the Target Server you will see that it fails to start. However, if your cluster fails over, the old target now becomes the source of the mirror, so you will want to start monitoring DataKeeper counters on that new Source. You could create a Cluster Generic Script Resource that starts the Data Collector Set upon failover, but that is a topic for another time.
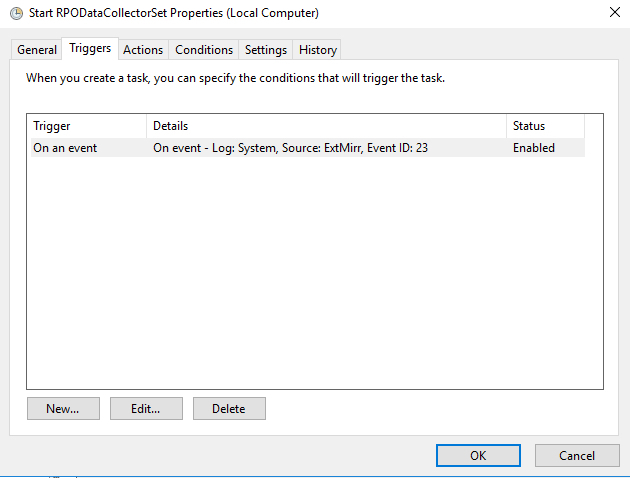
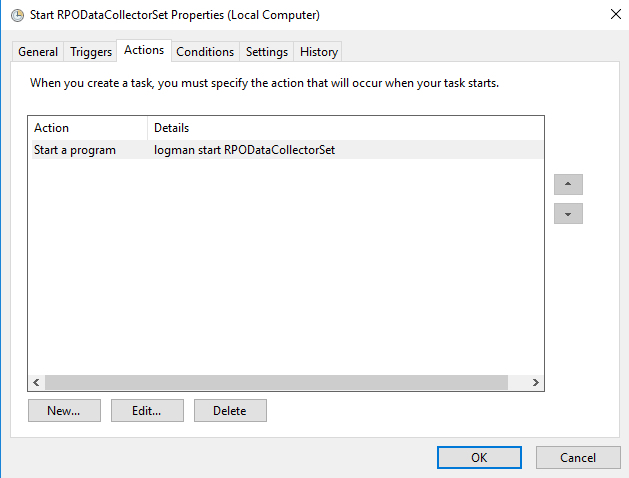
The easier way ensure the counter is running on the new Source is to set up a Scheduled Task that is triggered by an EventID that indicates the the server is becoming the source of the mirror. In this case I set up trigger on both Systems so that each time EventID 23 occurs the Trigger runs Logman to start the Data Collector Set. Every time a failover occurs Event ID 23 is logged on the new system when it becomes the source, so the Data Collector Set will automatically begin.
That’s it, you now can receive email Alerts directly from your server should any Perfmon counters you care about start getting out of hand.


