Query tuning ain’t easy.
Figuring out which index is getting used is one step, and generally simple, look at the execution plan to see which index is in use and whether it’s being used in a SEEK or a SCAN. Done. However, when your index isn’t being used, how do you tell how or why something else is being done? Well, that’s largely down to row counts which brings us to statistics.
Which Statistics are Used
Years ago I was of the opinion that it wasn’t really possible to see the statistics used in the generation of a query plan. If you read the comments here, I was corrected of that notion. However, I’ve never been a fan of using undocumented trace flags. Yeah, super heroes like Fabiano Amorim and Paul White use them, but for regular individuals like me, it seems like a recipe for disaster. Further, if you read about these trace flags, they cause problems on your system. Even Fabiano was getting the occasional crash.
So, what’s a safe way to get that information? First up, Extended Events. If you use the auto_stats event, you can see the statistics getting created and getting loaded and used. Even if they’re not created, you can see them getting loaded. It’s an easy way to quickly see which statistics were used to generate a plan. One note, you’ll have to compile or recompile a given query to see this in action.
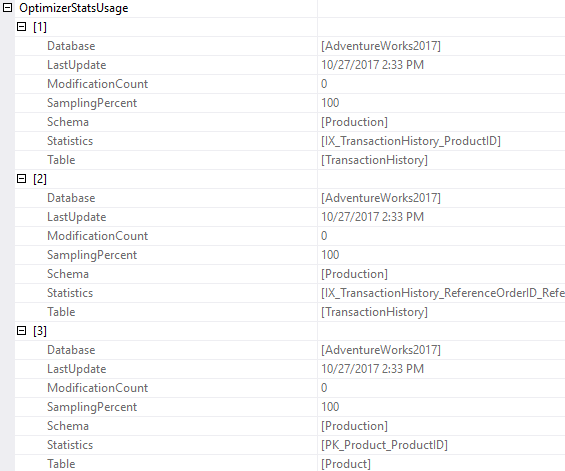
Next, released with the latest version of SQL Server Management Studio, the execution plan now shows the statistics being used and little bit of the information about them. I know this works with 2017. Based on the documentation, it certainly suggests it works back to 2014. The output is great:
So now, you can easily see all the stats in use during the generation of an execution plan, either capturing them using Extended Events or just looking at the execution plan.
How are those Statistics Used
Ok, fine, I can see the stats being used, but where and how are they used?
Great question. To truly, completely understand this, you’ll need to get out the debugger. However, if you want some more insight, there are a couple of options. First up, for 2014 and greater, you can use a trace flag like this:
SELECT p.Name,
       p.ProductNumber,
       th.ReferenceOrderID
FROM Production.Product AS p
    JOIN Production.TransactionHistory AS th
        ON th.ProductID = p.ProductID
WHERE th.ReferenceOrderID = 41617
OPTION (QUERYTRACEON 3604, QUERYTRACEON 2363, RECOMPILE);
This will output information like this:
Begin selectivity computation
Input tree:
LogOp_Select
CStCollBaseTable(ID=2, CARD=113443 TBL: Production.TransactionHistory AS TBL: th)
ScaOp_Comp x_cmpEq
ScaOp_Identifier QCOL: .ReferenceOrderID
ScaOp_Const TI(int,ML=4) XVAR(int,Not Owned,Value=41617)
Plan for computation:
CSelCalcColumnInInterval
Column: QCOL: .ReferenceOrderID
Loaded histogram for column QCOL: .ReferenceOrderID from stats with id 3
Selectivity: 1.34084e-005
Stats collection generated:
CStCollFilter(ID=3, CARD=1.52109)
CStCollBaseTable(ID=2, CARD=113443 TBL: Production.TransactionHistory AS TBL: th)
End selectivity computation
You’re given the selectivity for the statistic and the calculation being performed. Further, you get one other bit of data that is actually very useful, the stats id, 3 in this case. More on that in a minute.
The only issue here is that we’re back to undocumented trace flags with unknown results. Certainly not something to run against a production environment without the direct advice of Microsoft.
How else could we do it? Well, this isn’t quite as neat a solution as we have for seeing the statistics. We’re still going to be in, “maybe you don’t want to run this on production” territory. We can use the Extended Event query_optimizer_estimate_cardinality. The output is here:
JSON defines all the granular data. It’s roughly the same data as you see in the trace flag, but not identical. Personally, I’d say that it’s close enough, but I’ll leave that judgement for the real experts. It gives me most of what I’m looking for. This includes the calculation being performed, the stats and objects they belong to and the stats_collection_id value.
What the heck is that for you may ask?
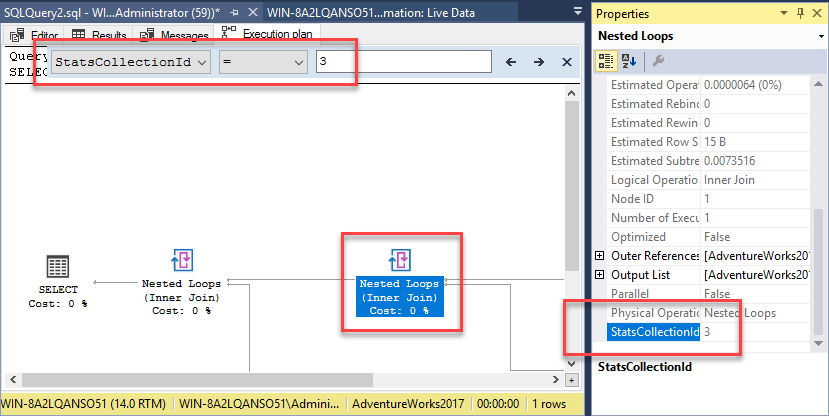
Let’s go back to the execution plan. If we use the new “Find Node” functionality, we can look for the StatsCollectionID property. Inputting the value of 3, the one for each of the two different outputs above, I can find the exact operator within the plan:
One note, not all the calculations you’ll see from the query_optimizer_estimate_cardinality are present within the execution plan. The details for this extended event are not well documented. The lack of documentation gives me pause. This is a Debug event. Now, that doesn’t mean it runs in the debugger. It does mean that Microsoft can, and probably will, change this without notice or may even drop it. I’m reluctant to suggest running any of the Debug events on a production system, just like I don’t like undocumented trace flags. However, I’m slightly more sanguine about the Extended Events than I am the trace flags.
Conclusion
If you’re like me and you’re not crazy about trace flags, you can still collect a lot of information that the trace flags offer. Either Extended Events or the execution plan show you which statistics are in use by the optimizer when it generates a plan. Using Extended Events, albeit a Debug event, you can see which calculations arrived at your plan. Best of all, you can see where those calculations were applied within the plan itself. All this gives you a lot more information to work with when troubleshooting query performance.
If you’re around for SQLSaturday Virginia on March 23rd, 2018, I’m doing an all day session on query tuning. Seating is extremely limited, so please sign up early.
The post Statistics Use, Extended Events and Execution Plans appeared first on Grant Fritchey.


