In the last post we looked at using the STATISTICS IO and STATISTICS TIME commands to measure query performance.
If you’ve started using these, you may notice that once you start to troubleshoot longer scripts or stored procedures that reference lots of tables or have multiple queries, you start getting lots of output. Sometimes it can sprawl across several screens worth. That can make it a a bit of a pain to total up the numbers, or to quickly see if a change you have made has had a positive effect.
Here’s the STATISTICS output from a troublesome query I was looking at recently:
SQL Server parse and compile time:
CPU time = 0 ms, elapsed time = 0 ms.
SQL Server parse and compile time:
CPU time = 140 ms, elapsed time = 140 ms.
SQL Server Execution Times:
CPU time = 0 ms, elapsed time = 0 ms.
(188 row(s) affected)
Table ‘ParameterValue’. Scan count 14, logical reads 2350, physical reads 0, read-ahead reads 0, lob logical reads 0, lob physical reads 0, lob read-ahead reads 0.
Table ‘ParameterDefinition’. Scan count 8, logical reads 456, physical reads 0, read-ahead reads 0, lob logical reads 0, lob physical reads 0, lob read-ahead reads 0.
Table ‘Worktable’. Scan count 8, logical reads 105600, physical reads 0, read-ahead reads 0, lob logical reads 0, lob physical reads 0, lob read-ahead reads 0.
Table ‘Workfile’. Scan count 0, logical reads 0, physical reads 0, read-ahead reads 0, lob logical reads 0, lob physical reads 0, lob read-ahead reads 0.
Table ‘ParameterDataType’. Scan count 0, logical reads 376, physical reads 0, read-ahead reads 0, lob logical reads 0, lob physical reads 0, lob read-ahead reads 0.
Table ‘Worktable’. Scan count 0, logical reads 0, physical reads 0, read-ahead reads 0, lob logical reads 0, lob physical reads 0, lob read-ahead reads 0.
SQL Server Execution Times:
CPU time = 2371 ms, elapsed time = 655 ms.
SQL Server Execution Times:
CPU time = 2511 ms, elapsed time = 797 ms.
Now that’s not too bad, and it’s fairly simple for me to add up the numbers of reads. But you also can find yourself copying and pasting the output from several iterations of changes into notepad documents or query windows so you can compare them later, and it can become a bit of a pain to keep track of.
That’s what I used to do, until I discovered the STATISTICS parser tool.
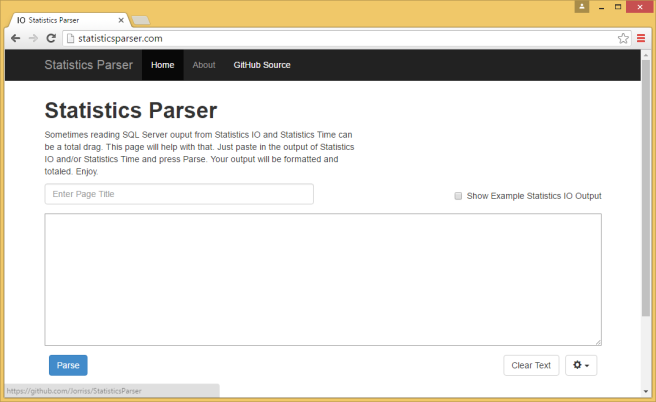
This a free web-based tool to help you keep track of your STATISTICS output, which will also format the results nicely for you and produce totals. It’s very simple and easy to use:

You simply paste the STATISTICS output into the big box and hit the “Parse” button. You can also enter a Page Title that will become the name of the Tab in your browser to make it easier to keep track of different sets of output.
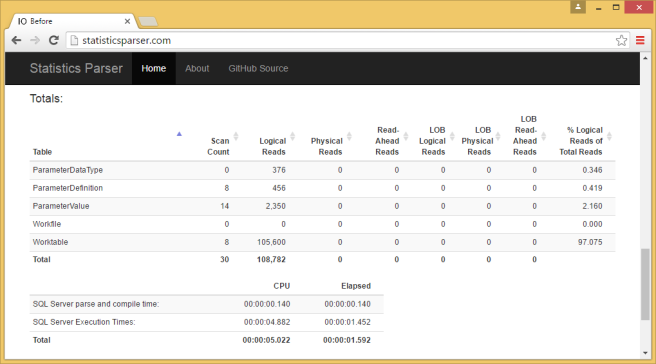
The parser will turn the set of output for each query into an easy to read table and then will also provide a Totals table that shows you (not surprisingly) the totals across all your queries. Here’s the output above formatted via the tool (I am just showing the final totals):

Personally I find that significantly easier to read!
Watch out though, the total CPU time can be double-counted. This is because the STATISTICS TIME output can sometimes include a total itself. If I look at just the TIME sections from the output above I have:
SQL Server parse and compile time:
CPU time = 0 ms, elapsed time = 0 ms.
SQL Server parse and compile time:
CPU time = 140 ms, elapsed time = 140 ms.
SQL Server Execution Times:
CPU time = 0 ms, elapsed time = 0 ms.
SQL Server Execution Times:
CPU time = 2371 ms, elapsed time = 655 ms.
SQL Server Execution Times:
CPU time = 2511 ms, elapsed time = 797 ms.
If you look carefully at that you’ll see that the last set of entries (CPU time = 2511ms, elapsed time = 797ms) are totals of the other numbers. If you then look at the Statistics Parser output above you’ll see that it has added those to the previous outputs to give a total CPU time of 5.022 seconds (5,022ms).
Still we’re mainly interested in getting the IO down so I ignore that for now. The main thing I’m interested in is the total number of reads:
108,782
I make my changes to the stored procedure, execute it and get the STATISTICS output again:
SQL Server parse and compile time:
CPU time = 0 ms, elapsed time = 0 ms.
SQL Server parse and compile time:
CPU time = 0 ms, elapsed time = 0 ms.
SQL Server Execution Times:
CPU time = 0 ms, elapsed time = 0 ms.
SQL Server Execution Times:
CPU time = 16 ms, elapsed time = 0 ms.
SQL Server Execution Times:
CPU time = 0 ms, elapsed time = 1 ms.
(189 row(s) affected)
SQL Server Execution Times:
CPU time = 0 ms, elapsed time = 0 ms.
(188 row(s) affected)
Table ‘Workfile’. Scan count 0, logical reads 0, physical reads 0, read-ahead reads 0, lob logical reads 0, lob physical reads 0, lob read-ahead reads 0.
Table ‘Worktable’. Scan count 0, logical reads 0, physical reads 0, read-ahead reads 0, lob logical reads 0, lob physical reads 0, lob read-ahead reads 0.
Table ‘ParameterDefinition’. Scan count 2, logical reads 396, physical reads 0, read-ahead reads 0, lob logical reads 0, lob physical reads 0, lob read-ahead reads 0.
Table ‘ParameterValue’. Scan count 3, logical reads 708, physical reads 0, read-ahead reads 0, lob logical reads 0, lob physical reads 0, lob read-ahead reads 0.
Table ‘#ParameterNames_____________________________________________________________________________________________________0000000000CB’. Scan count 2, logical reads 718, physical reads 0, read-ahead reads 0, lob logical reads 0, lob physical reads 0, lob read-ahead reads 0.
Table ‘ParameterDataType’. Scan count 1, logical reads 2, physical reads 0, read-ahead reads 0, lob logical reads 0, lob physical reads 0, lob read-ahead reads 0.
SQL Server Execution Times:
CPU time = 78 ms, elapsed time = 80 ms.
SQL Server Execution Times:
CPU time = 0 ms, elapsed time = 0 ms.
SQL Server Execution Times:
CPU time = 94 ms, elapsed time = 83 ms.
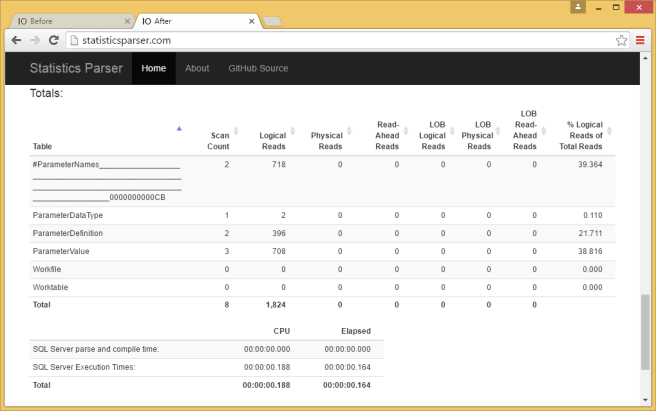
You can see my output is getting longer and starting to become more challenging to read – I broke the original query down into a few simpler steps, but each produces its own output. No worries, I open up a new tab in my browser and go to a second instance of the Statistics Parser. I give this one the Page Title “After”. I paste in my output and I hit parse:

You can now see I have a “Before” and an “After” tab so it’s easy to flick back and forth if I’ve forgotten my totals.
I can now easily see that my total number of reads – previously 108,782 – is down to 1,824. That’s about 50 times better. The CPU time is down by a factor of about 25, not as good as the reads, but I call that good enough and proclaim that tuning task complete!


