One of the challenges with managing a production database is that the code that gets deployed sometimes causes lots of problems. Often a production DBA or sysadmin gets called about problems that they didn’t cause, and can’t necessarily fix.
Helping developers learn what the impact of their code is, and if it is following good practices, is something many of us would like to do, but often don’t have the time, or a good report that we can easily pass on.
I saw recently that the SQL Monitor team had deployed a new feature to the product that makes this a bit easier. They have incorporated the code analysis from SQL Prompt into SQL Monitor, which you can see at https://monitor.red-gate.com/overviews/sqlmon-vmw-bm.red-gate.com/cluster/workload01.smdemo.local/sql/demo#?Zoom=1619213137440%2C1619220337440&MaxTime=1619220337440&Present=true
I’ve linked to one of the workload demo systems being monitored. If you look at the top 10 queries, and pick one, you’ll see something like this:
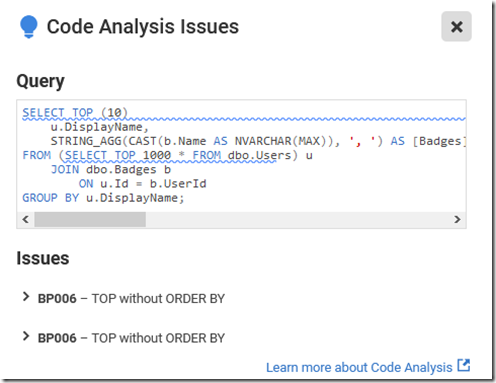
Just below the query text, there is a blue lightbulb (for a new feature) and the text: SQL Monitor has identified 2 issues with this query. Addressing them could improve performance.
Clicking the link gives you the issues. In this case, these are code smells that I’d want a developer to address. Having a TOP without any ordering could confuse clients, but it also might mean we are gathering the wrong data, since there isn’t a guarantee on which 10 rows come back.
You can screen shot this, or send this link to developers, and ask them to fix this code for the next deployment.
SQL Monitor has become an impressive product over the years, and with multiple teams adding to it now, it is constantly evolving to meet the needs of our customers. If you haven’t tried it, consider an evaluation before you purchase a monitoring tool (or before you build one).


