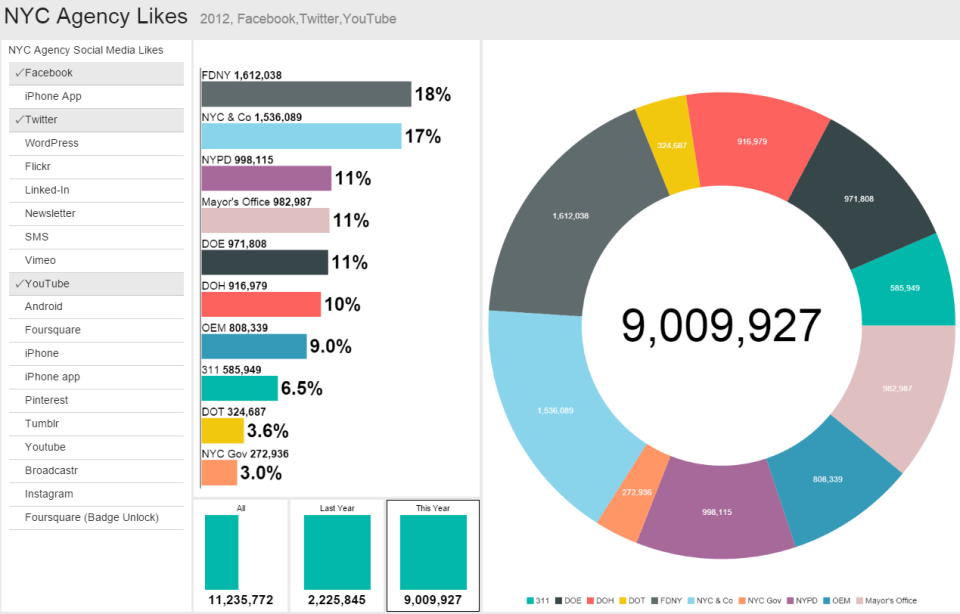
This is the final post of 3 on SSRS 2016. This time I’m looking at the new SSRS 2016 mobile reports.
Post 1 covered the basics of creating your first paginated report.
Post 2 covered the new features for the SSRS portal and paginated reports.
Mobile Reports
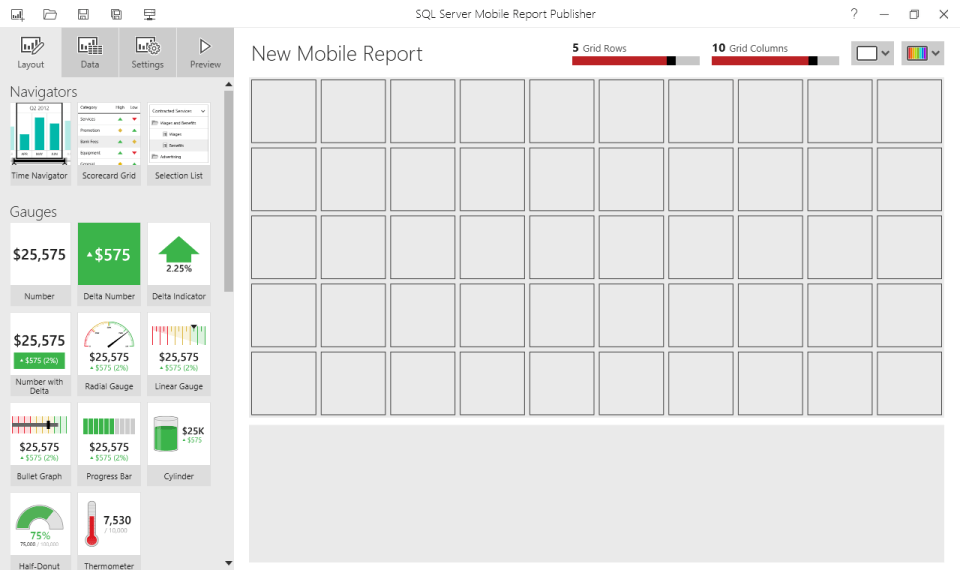
To install Mobile Report Publisher, click the down arrow in the SSRS portal and select the Mobile Report Publisher. Download the installer and click through to the end. Install the C++ redistributable. If you have used DataZen then the designer will look very familiar.
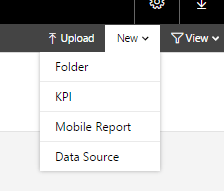
Before we can start building our mobile report, we need a data source and a data set. I’m creating a shared data source in the new SSRS portal.
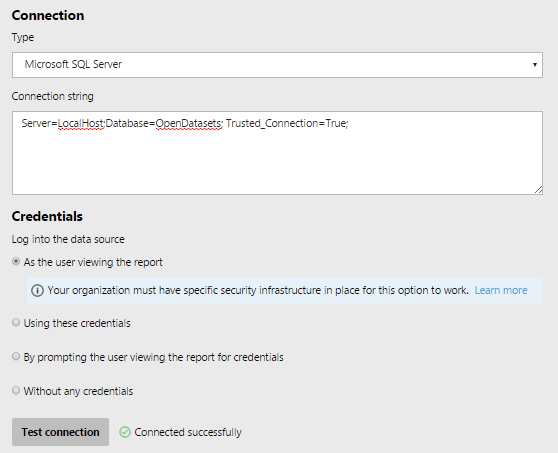
I used this simple connection string but you may require a different setup depending on your environment. If you need help try connectionstrings.com for templates.
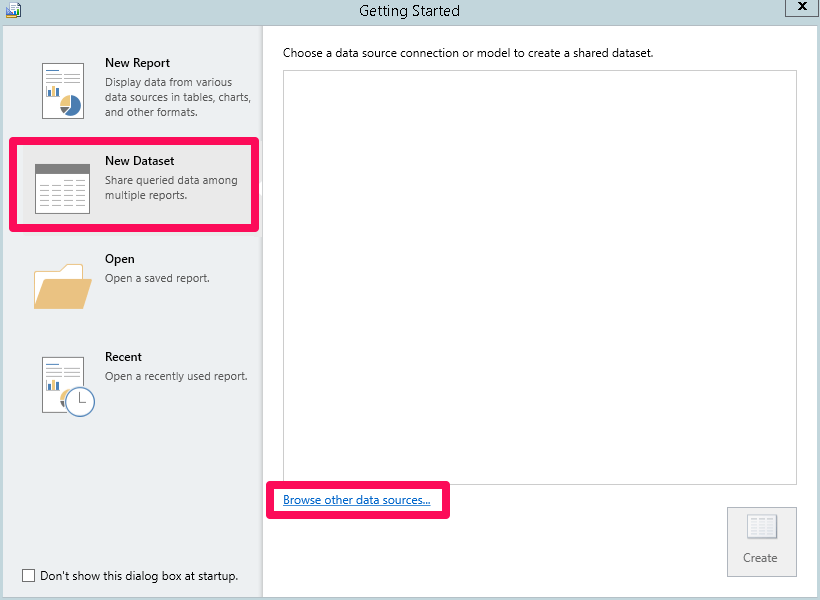
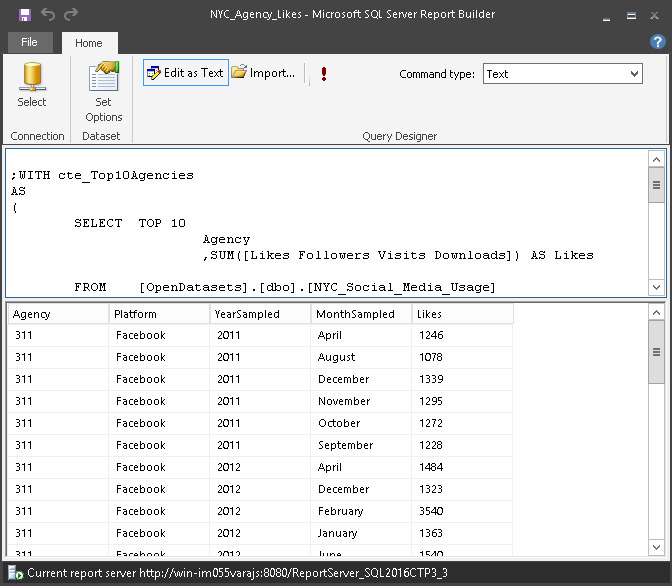
Datasets have to be built in the Report Builder.
Browse other data sources to select the shared data source we created in SSRS. Double click your SSRS server and select your dataset.
The query used here is very similar to the one I used in Importing Open Datasets in SQL Server. Once you have a query that returns data, save the dataset to your SSRS server.
Connect the Mobile Report Publisher
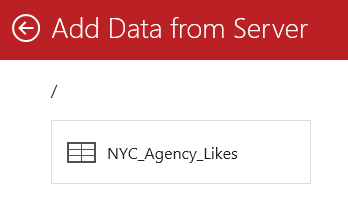
We now have all we need to start building our first Mobile Report. Select Data at the top of the panel on the left of the designer. Then click add data, SSRS Server and your server name. If you saved your dataset in the root folder of SSRS, you will see something like the screenshot below.
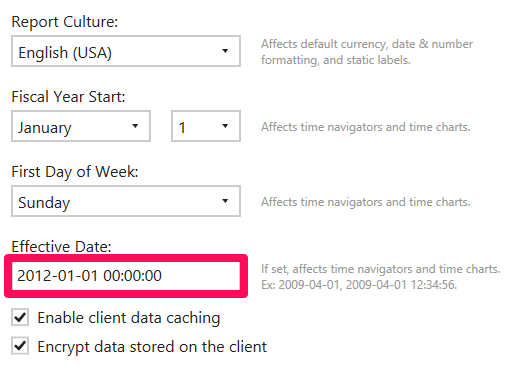
The data in my open dataset (that I got from datagov.com) starts at 2011-01-01 and ends at 2012-12-12 so for this example I went into settings at set the Effective Date to 2012-01-01. This way the report can be used to draw comparisons between the two years that my data covers.
Mobile reports can include interactive objects that can filter the data feeding the other visulisations. For this report, I want the users to be able to filter the data on the social media platforms and the date. To do this, I will use a Selection List for the platforms and a Time Navigator for the date.
Selection List
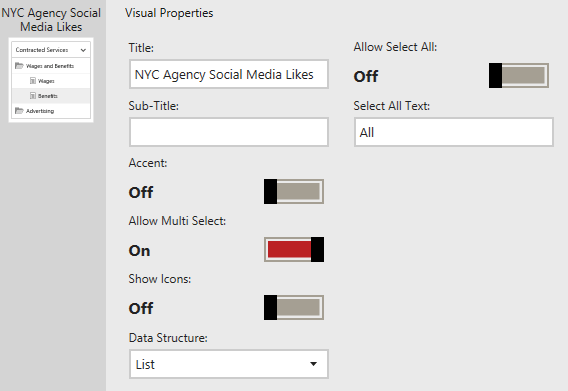
As I’m not dealing with currency, I configured the Number Format of each visualisation to general. The default is Currency. Below are my layout settings for the selection list. I have switched Allow Select All off as the user can achieve this by deselecting any filters they have applied.
In the Data Section check the key fields are correct for your data. This may take some experimentation.
Time Navigator
We need a datetime column in our dataset for this to work. Select appropriate values for Time Levels and Time Range Presets.
Charts
Now that our interactive filters are in place, we can add the charts and gauges. I will be using a Total Chart and a good old Pie Chart. For my data it made sense to set the Data Structure property to By Rows. On the data pane select the category to group the data by. Simulated datasets can only be removed once they have been deselected on all items.
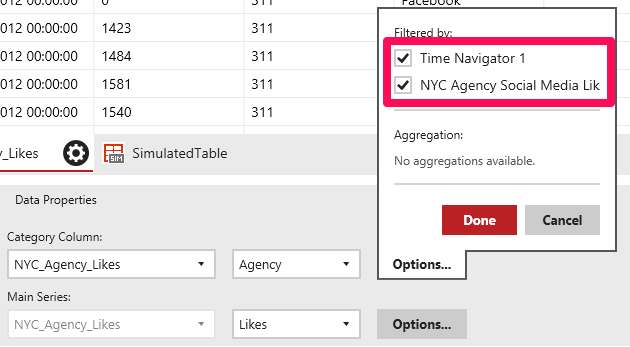
Click Options on the category section in the data pane to make sure the Selection List and Time Navigator are selected to filter the data for each data visualisation.
Before you can save the report, you need to create a mobile view. You can select all or a subset of the visualisations you configured in the master view. You can also select a different layout for tablets.
Select save to server to publish to SSRS. If you have folders in SSRS, you can select a loction for the report otherwise just select the root.
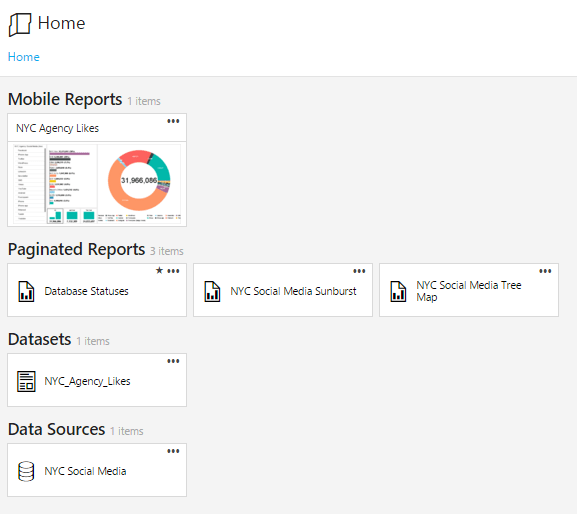
 You can then see your report and it’s components in the SSRS portal.
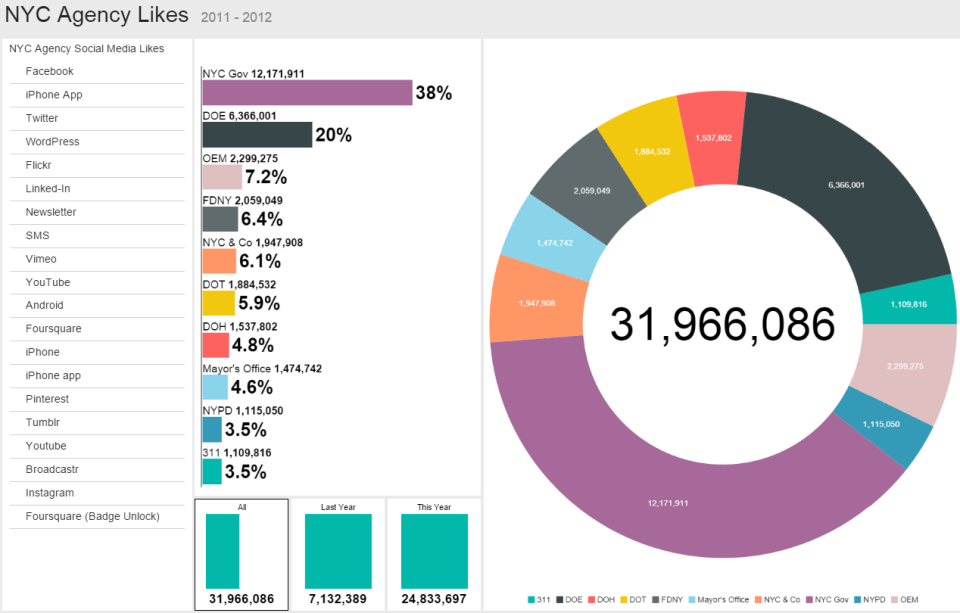
You can now view your report in your browser.
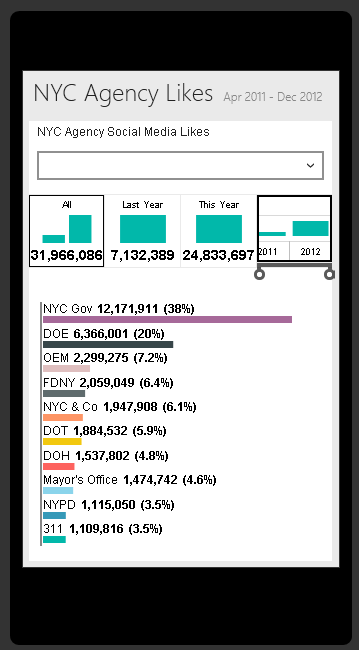
You can also filter your report.
And you can do all of this on IOS and Android devices.
KPI
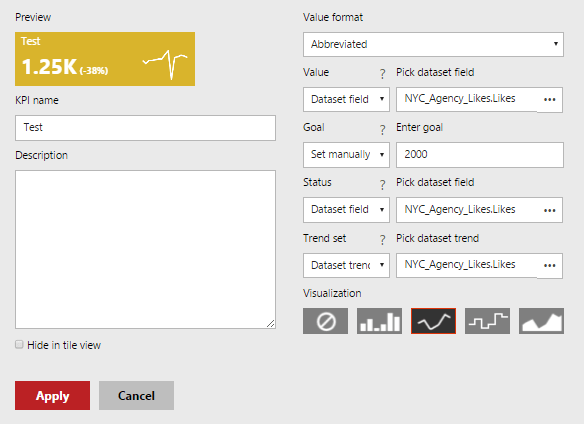
The last feature I want briefly mention is the KPI feature. This lets you add simple visualisations to the SSRS portal. This enables your users to see data without having to click a report and set parameters or filters. My dataset wasn’t exactly right for the purposes of a KPI but the screenshot below shows how simple and quick they are to setup. What you see in the top left is what will appear in the portal alongside your reports.
Since I started this post, SQL Server Release Candidate 0 was released – so far it only seems to include small fixes for stability.
Well that’s it for me and SSRS for a while. I hope you enjoyed this short series of posts.
The post SSRS 2016 – Part 3 Mobile Reports appeared first on The Database Avenger.


