In my experience, there have been occasions where SQL Server Management Studio (SSMS) becomes unresponsive for a length of time. In one particular case, this occurred while I was expanding the list of databases. SSMS just sat there and waited for some unknown reason and became frustrating. The client eventually did respond and life was good again.
The frustrating part is not knowing what is going on behind the scenes. However, I’ve recently learned that you can see what the client is doing when certainly actions are performed, such as expanding the list of databases from within Object Explorer. In fact, there is a query is executed. But how do we see that query?
Stage left; Enter the Output Window.
Output Window
From Books Online (BOL):
This window displays status messages for various features in SQL Server Management Studio. Output is delivered to special panes in the Output window from the Transact-SQL debugger, external tools features, or commands that are run in the debugger Command Window
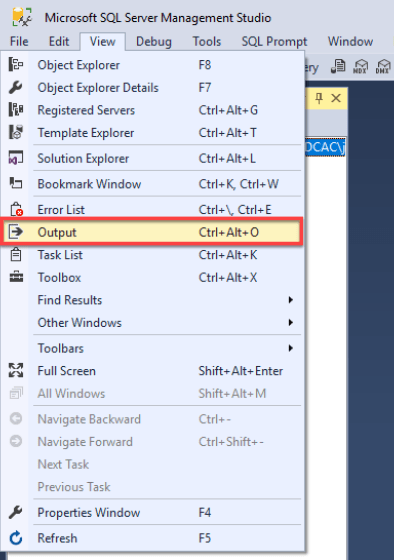
You can enable the Output window by selecting it from the View menu.
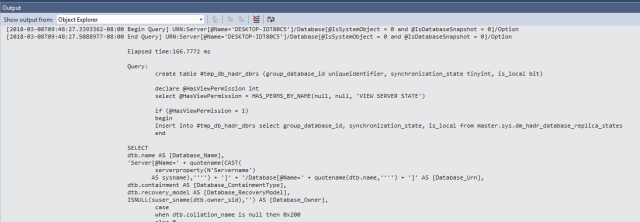
When enabled, you can now see the query that is performed when doing certainly tasks within Management Studio. For example, when expanding the Database branch, I can see the resulting query:

Note that you also get some statistical information about the query such as the elapsed time. You can manually execute this query and see the results. I think that it is interesting while the UI only displays the database name and some metadata about the database, such as if it’s in recovery or read only, the query in reality returns a great deal more information.

Telemetry
Another benefit of the Output window is Telemetry. The fact is that Microsoft needs to get feedback in order to improve their products. The only way that they can get this feedback is by receiving some type of telemetry on how things are working. This can be done either anonymously or not. After spending this week in Redmond, Washington at the 2018 Microsoft MVP Summit, I can assure you that they really want feedback.
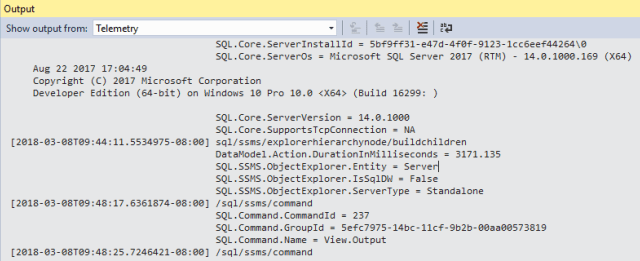
You can see this telemetry by selecting it from the drop down menu.
Once telemetry has been selected, you will then see the data that is gathered.
You can configure SSMS to either automatically send this data back to Microsoft or not. The choice is completely up to you whether you do or not. Keep in mind that Microsoft does not collect any sensitive data.
As per the documentation:
Specifically, Microsoft does not send any of the following types of information through this mechanism:
- Any values from inside user tables
- Any logon credentials or other authentication information
- Personally Identifiable Information (PII)
Also, since we are on the topic of telemetry, my colleague Joey D’Antoni interviewed Conor Cunningham, partner architect for SQL Server/Azure SQL at Microsoft, where they discussed telemetry and how this helps various SQL Server products (both on premise and in the cloud) to be better. The two part series is a good read and I’d recommend taking 10 minutes to do so. You can find the first post here.
Summary
The output window in SSMS offers up deeper insight on what the client is really doing behind the scenes. This is useful for when SSMS isn’t behaving as expected and you can use this tool to help identify potential issues by seeing the queries being executed. Also, it is handy to have the ability to see some of the telemetry that might be sent back to Microsoft. While some will think this is big brother watching over us in a creepy way in reality Microsoft uses this information to make the products better
Enjoy!
© 2018, John Morehouse. All rights reserved.


