In the Part 1 about SQL server Statistics, we have discussed about density vector information stored in the the statistics. In this post, let us discuss about the histogram. Let us create a copy of SalesOrderDetail table and two indexes on top of that as we did in our first part.
USE mydb
GO
SELECT * INTO SalesOrderDetail FROM AdventureWorks2008.Sales.SalesOrderDetail
CREATE UNIQUE CLUSTERED INDEX ix_SalesOrderDetailID ON SalesOrderDetail(SalesOrderDetailID)
CREATE NONCLUSTERED INDEX ix_productid ON SalesOrderDetail(productid)
Let us see the histogram information of the non clustered index.
DBCC SHOW_STATISTICS('dbo.SalesOrderDetail', 'ix_productid') WITH HISTOGRAM
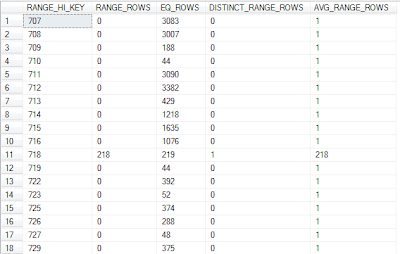
You can see 200 records in the output. I have shown only the first 18 records. To create the histogram, SQL server split the data into different buckets (called steps) based on the value of first column of the index.Each record in the output is called as bucket or step.The maximum number of bucket is 200 based on the data distribution.Histogram is a statistical representation of your data.In other words it is the distribution of records based on the value of first column of the index. Histogram is always based only on the first column of the index even if the index is composite one.This is one of the reason why it is always suggested to have most selective column as the first column of the index, but there are exceptions.
Let us look at the output of the histogram. It tried to put the 121317 records in the table into 200 buckets (steps) based on the value of productid.
The RANGE_HI_KEY column represent the upper boundary of each bucket.The lower boundary of each bucket is the RANGE_HI_KEY+1 of the previous bucket. For the first bucket, the lower boundary is the smallest value of the column on which the histogram is generated.
The RANGE_ROWS column represent the number records in that bucket range but not equal to the value of RANGE_HI_KEY. The value 0 on the first record says, there is no record in the table whose productid value is less than 707. If you look into the 11th record with RANGE_HI_KEY value 718, we have 218 in the RANGE_ROWS column .This says ,there are 218 records with productid value is greater than 716 (previous RANGE_HI_KEY) and productid value is less than 718. The output of below query proves that:
SELECT COUNT(*) FROM SalesOrderDetail WHERE productid>716 AND productid<718
The EQ_ROWS is the number of records in the table matching with RANGE_HI_KEY. For the first records, 3083 in the EQ_ROWS says that there are 3083 records in the table with productid 707.The output of below query proves that:
SELECT COUNT(*) FROM SalesOrderDetail WHERE productid=707
The DISTINCT_RANGE_ROWS represent the number of distinct records (distinct productid ) between two RANGE_HI_KEY values. If you look into the 11th record with RANGE_HI_KEY value 718, we have value 1 in the DISTINCT_RANGE_ROWS column .This says ,there is only 1 distinct records withe productid value is greater than 716 (previous RANGE_HI_KEY) and productid value is less than 718. The output of below query proves that:
SELECT COUNT(distinct productid) FROM SalesOrderDetail WHERE productid>716 AND productid<718
The AVG_RANGE_ROWS column represent the average number of rows per distinct values.This is equivalent to RANGE_ROWS / DISTINCT_RANGE_ROWS when RANGE_ROWS value is greater than 0. Otherwise AVG_RANGE_ROWS is considered as 1.
How SQL server optimizer use the histogram for cardinality estimation ? Let us consider the execution plan of the below query.


