Microsoft as a company has entered a new phase of innovation under the leadership of their CEO Satya Nadella. In the database world, few of the things that came out of this innovation are SQL Server for Linux, Azure SQL Database, Azure SQL Datawarehouse, etc. As the technology stack, in general, is undergoing a radical shift, the tools that interface to these technologies must, therefore, evolve along.
SQL Server Management Studio (SSMS) and SQL Server Data Tools (SSDT) are the de facto tools used by both SQL Server Database Administrators and SQL Developers for Database Administration and Development. As more and more functions are required of these tools as a direct result of the ever-changing technology landscape, these tools may fall short in some aspects. This is most true for other people that need connectivity to their databases to manage and monitor them, especially the Application Developers and DevOps Engineers.
Database Administrators, developers, DevOps, and those that are involved in the business operations need a flexible tool that they can utilize to deliver solutions effectively to the business. And, equally important is that this tool must be technology agnostic.
This is where SQL Operations Studio (SOS) comes in the picture. SOS is a lightweight, cross-platform client. It is also open-source. Aside from its IDE functionalities, SOS has a lot of more offerings for DBAs, Devs, and DevOps. One of these is that you can use it as a dashboard to monitor your databases. SSMS comes with standard reports as well as custom reports using Report Definition Language or RDL (which is essentially an SSRS-like report residing in SSMS). SQL Operations Studio raised the bar in this regard. You can create multiple widgets to display on your dashboard.
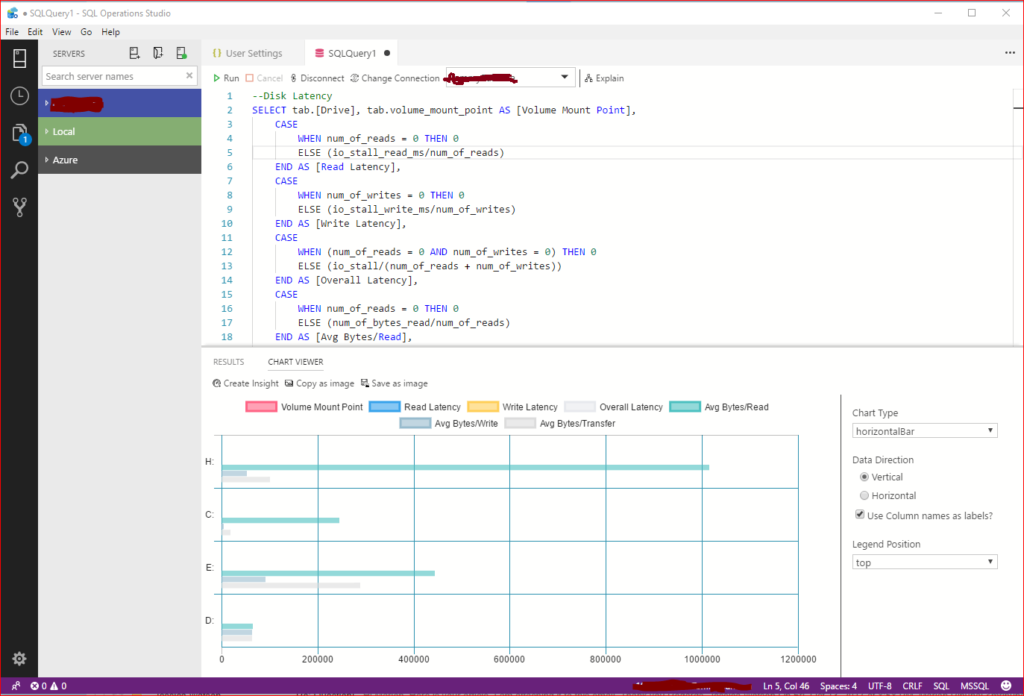
I have here a query that returns disk latency info. Here’s how easy to add this info as a widget in the SQL Operations Studio Dashboard:
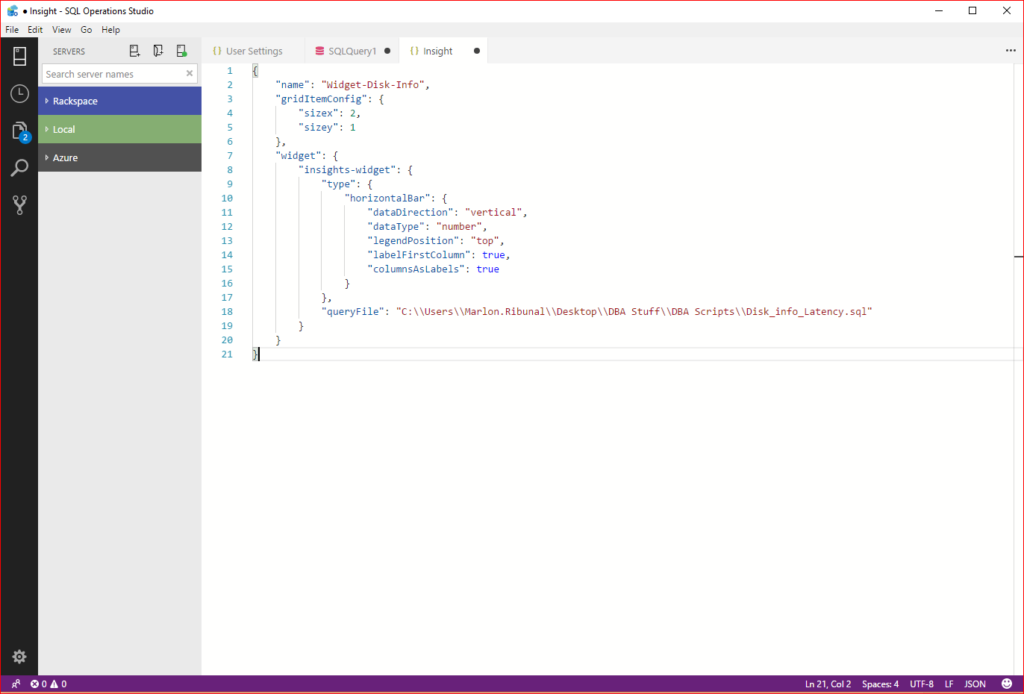
First, view the results as a Chart (see screenshot above). Click Create Insight to pull the JSON code behind the chart. Copy this code.
Go to the User Setting tab (Click CTRL+ Comma if you’ve closed it). In the search box, type dashboard.database.widgets. If you hover your cursor over the code, that will show a pencil icon. Click the pencil icon to Edit/Copy the Setting to the dashboard. Paste the whole block of JSON code from the Insight tab. Then save user setting.
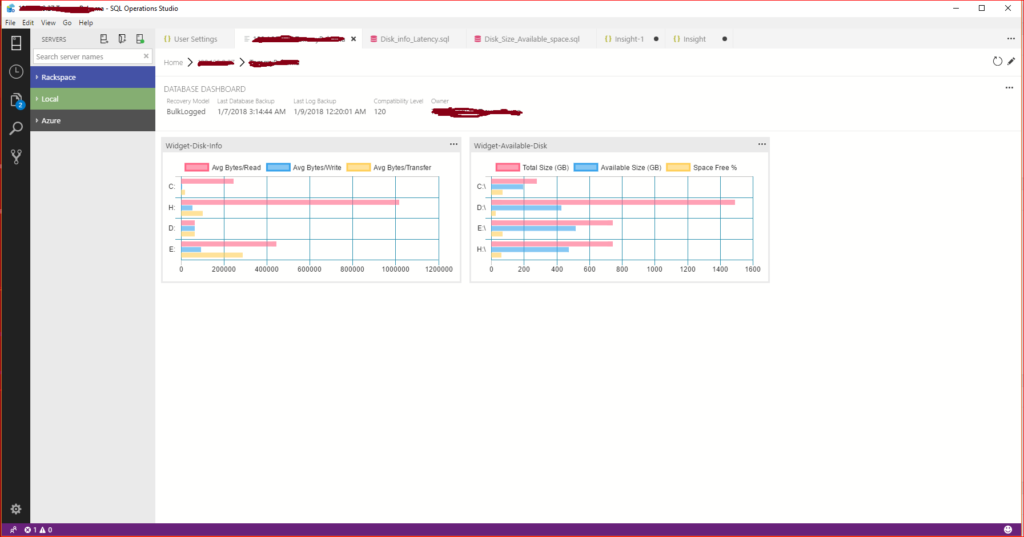
If you go to the Server panel, right-click on the database and select Manage, you should now see something like this (I added another widget in this case):
The post SQL Operations Studio As Monitoring Dashboard appeared first on SQL, Code, Coffee, Etc..


