When you need to manage a number of SQL instances, monitoring them becomes one of your priority task. In some large environment, you might have some third party tools to help you do that. System Center suite have Operation manager (SCOM) which can helps you monitor servers along with SQL server. Not to mention other tools such as Foglight, Spotlight, SQL diagnostic manager etc, those are all great tools with alerts and historical data. However, they do all require a big installation and the cost of them might not fit your budget.
If you are running in a shop that is limited in budget (who isn't now days), where you cannot get those tools, you might need to write custom code to send out alert on each instance and that's pretty much it, however you cannot see in a single glance on the healthiness of all your SQL instances!
Here is what I come up with, a very simple health check that checks and record some key information of the db instance, with a display works great on your desktop where you can put that on the side and it will alert you when your instance is having issues. Such as the page life expectancy drops or blocking occurs. Where you can either look at the blocking info from the app, or the trend of PLE, to see if you require to login to the instance for troubleshooting.
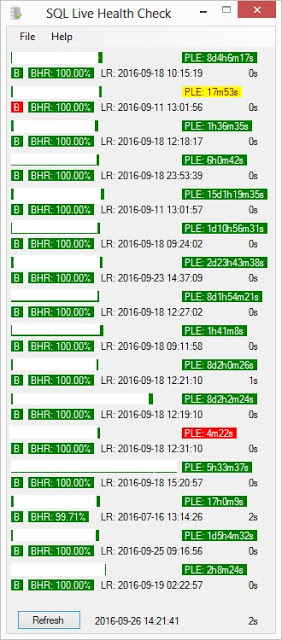
The Main screen (listed below) shows you all the db instances you are currently monitoring and their base info:

* server name was hidden as demo
As you can see in the screenshot above, it has clear color coding that alerts you when something is wrong, and you can configure the threshold for buffer hit ratio and PLE to suit your needs.
You can see that the screen contain 2 lines for each db instance, let me get to the details of each:
The first line contains the db instance name (hidden for demo) and PLE shown in readable friendly format, the second line have 4 items as below:
| B | if any blocking occurs at the moment, red means blocking is detected |
| BHR | buffer hit ratio value |
| LR | DB instance last restart date |
| 0s | last part is the number of seconds it took to capture the info, 0s means less then 1 second. |

The bottom part have a refresh button that allow you to make a manual collection refresh if required, the date next to it show the last refresh time, where if you have auto refresh enabled (configurable), it will keep update and show you when it was last executed. The last part shows the total time it took for the overall collection (2 seconds for this case). The difference between this to the one for each server is that this is the total time taken for all servers, where the one for each server shows the time taken for that given server. As you can see from the demo above, we have 16 db instances and it only take 2 seconds to capture all info, which is very fast and lightweight for the db instance.
This helps to show you in a single glance the healthiness of all your db instances, when anything changed to red, it should be something one should pay attention to, this helps to simpler the monitoring and helps DBA to be alerted if anything happens.
In the next post, I will go through the rest of the app and how you can configure the thresholds. If you like to try it out now, please feel free to go here for download (https://sqlhealthcheck.codeplex.com/).


