- Pipe the output of a Powershell command to automatically create a chart.
- Display the chart in a Windows Form
- Save the chart to an image file
- Specify either bar, column, line or pie chart types
- Display real-time automatic updating charts by passing scriptblock to the function. The scriptblock will execute at the specified interval and display chart updates (think Perfmon)
- Works with Powershell V1
To use the Library (Note: Requires .NET 3.5 framework):
- Download and install Microsoft Chart Controls for Microsoft .NET Framework 3.5
- Download LibraryChart
- If you want to extend/use MS Chart Control grab the document and samples. I referred to the C# WinForm samples frequently.
Here are a few examples:
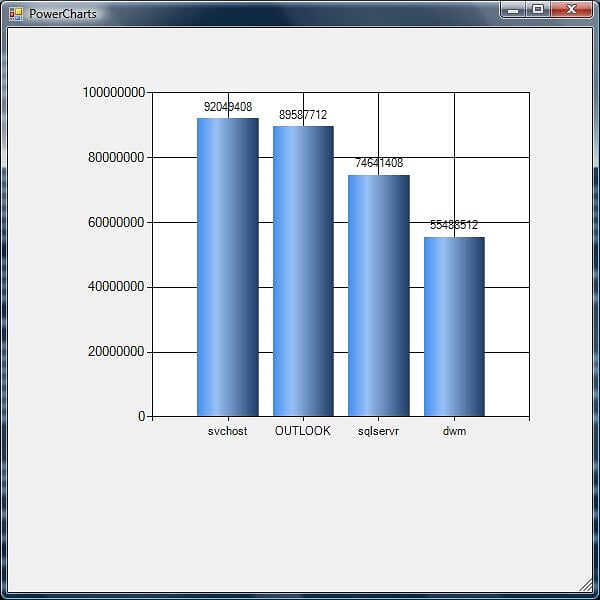
Create a column chart of process workingset information:
Get-Process | Sort-Object -Property WS | Select-Object Name,WS -Last 5 | out-chart -xField 'name' -yField 'WS'
Save the chart to a file instead of displaying:
Get-Process | Sort-Object -Property WS | Select-Object Name,WS -Last 5 | out-chart -xField 'name' -yField 'WS' -filename 'c:\users\u00\documents\process.png'
Get-Process | Sort-Object -Property WS | Select-Object Name,WS -Last 5 | out-chart -xField 'name' -yField 'WS' -chartType 'Pie'
Produce a real-time line chart of process working set by passing a scriptblock i.e. the Powershell command between the two curly brackets. (Image note shown):
out-chart -xField 'name' -yField 'WS' -scriptBlock {Get-Process | Sort-Object -Property WS | Select-Object Name,WS -Last 1} -chartType 'line'
I'm not entirely happy with the script (uses global variable, hash generation code repeated, pie and line chart appearance could be improved), so if anyone would like to take the charting library even further go for it!


