I just did a series of Boogle searches and when that didn’t find anything I tried Ging. Neither listed sys.dm_db_wait_stats. Nothing in a search directly against MSDN either. So, let me introduce you to a new DMO, sys.dm_db_wait_stats.
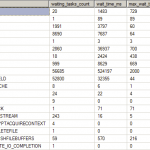
It’s a dynamic management view since it doesn’t require any input. The output is about what you would expect if you thought about it for a second:
In short, what we have is the sys.dm_os_wait_stats moved internally into your SQL Database so, even though you cannot get at any of the OS counters from with an a SQL Database normally. In short, thanks Microsoft. Now we can see the wait statistics on our Azure SQL Database in order to better understand where things are problematic.
Without documentation I don’t know for sure how far back these stats go. But like the other wait stats, the best way to use them would be to query them twice, say, once an hour ago and once now, or once yesterday and once today. Having two comparison points is how the values prove useful anyway. It’s likely that they reset when your instance moves. I’m working on trying to confirm this.


