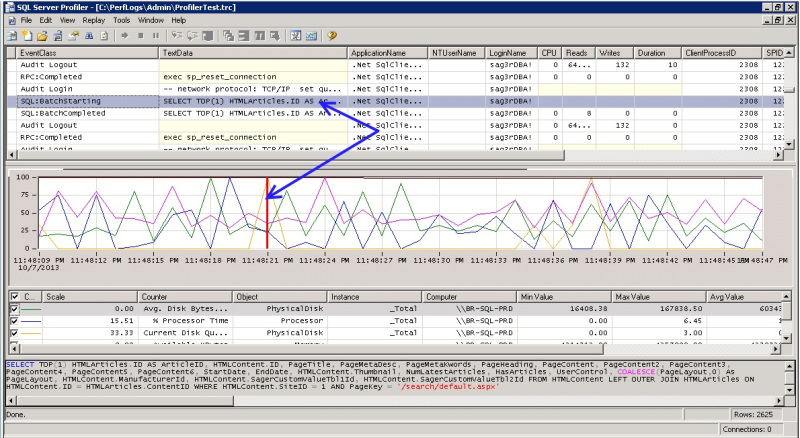
There is a way by which we can merge the .trc and .blg files to get a great view as below :
We have SQL Server Profiler event data in the top pane and PerfMon data in the middle. Data from both PerfMon and Profiler is correlated. If you click on a Profiler record on the top pane, a red marker in the PerfMon window jumps to the point in time for that Profiler entry. And vice versa, if you click on the perfmon chart, say, just before disk I/O activity begins to rise, the Profiler event in the top pane is highlighted.
The SQL or T-SQL statement issued by that Profiler event is shown in the bottom third pane.
These two performance tools are present in all versions of SQL Server.
PerfMon shows the overall resource consumption of Windows. On the other hand, Profiler shows specific events as they occur inside the SQL Server.
PerfMon helps identify the bottleneck on resources, not the exact problem.
Using the overlay of perfmon chart and profiler events, when resource consumption, say CPU or Disk I/O, gets high, we can tell exactly what statement, batch, or job caused it.
Below are the steps to get this surreal overlay :
1 Start PerfMon counter log and record to a file.
2 Start Profiler trace and record to a file.
3 Stop recording to both files after sometime.
4 Open SQL Profiler -> select File -> Open > Trace File > abc.trc
5 Then again -> select File -> Import Performance Data -> perfmonOutput.blg
6 Select the PerfMon counters.(You may get a waring but proceed)
At this point, you should have an overlay as shown in the screenshot before.
Click on a particular event in profiler pane and see how the red marker navigates in perfmon chart.
By correlating, you can exactly pinpoint which SQL statements have affected performance.
Quite simple !!


