Performance tuning is one of those things that is hard to get right when you do not have an established methodology of how to approach the problem.
Consider this scenario.
The application users are complaining about their app being so slow and explaining further that they didn’t do anything out of the ordinary. You confirmed with the dev team that they didn’t release any changes to the underlying data structure that could have caused the slow performance of the application.
This might just be one of those glitches that go away if you just ignore them, you thought to yourself. Although you very well know that this time it’s not the case. What makes this bad is, one, you’re not a DBA; and, two, which makes it worse, you do not have a DBA at all.
And since you are the go-to guy/gal whom everybody asks for anything and everything about technical, you are now tasked to troubleshoot this performance issue. Congratulations! You’ve just earned your official accidental DBA badge!
It’s easy to get overwhelmed with the number of things that you have to look into to get to the bottom of things. Is it a disk issue? Network issue? Is it SQL Server itself? Or, code issues?
If you are like most accidental DBA’s or those that are forced to manage their SQL Server databases, you can establish a heuristic approach to performance tuning:
Task Manager: CPU / Network / Memory
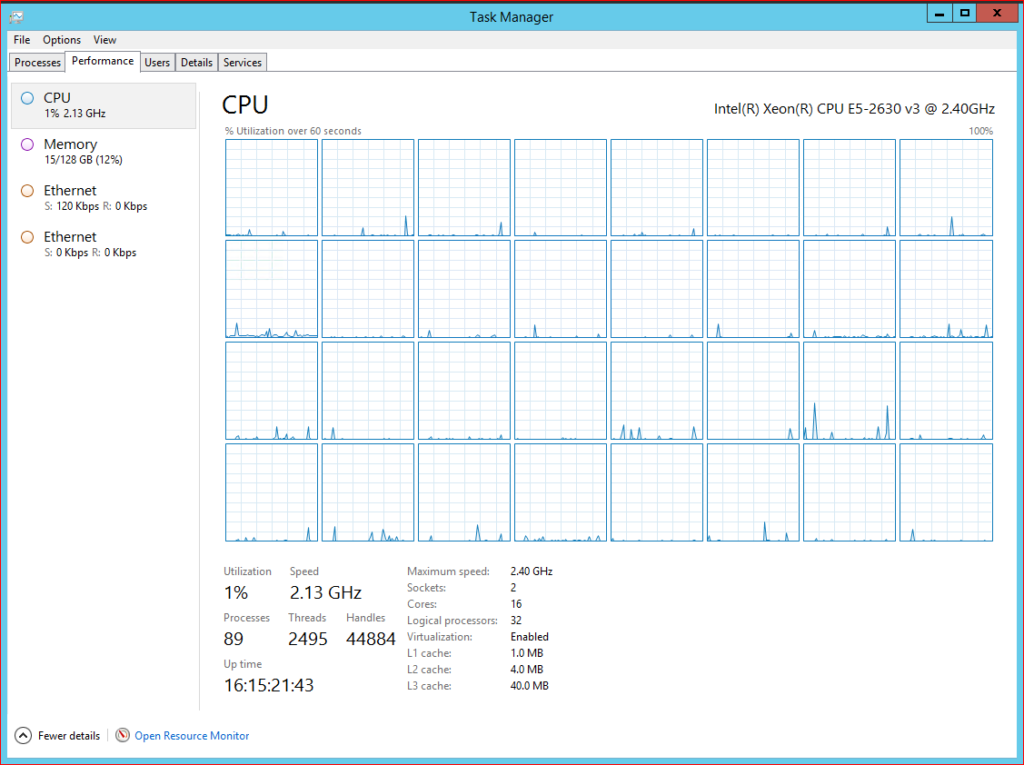
The first thing that I might look into is the CPU performance. This is for a simple reason – accessibility of this information. I can just fire up the Task Manager and see if there is any pressure on the CPU of the application server.
Is the CPU maxed out? What are the processes that are hogging the CPU? The task manager could also give me a peek at what’s going on with the Network and Memory utilization. This is where baselining is critical. You must have a baseline of how your CPU, Network, and Memory look like during your busiest time of the day. From here, you can have an idea if one of these may be an issue.
So, if there is an abnormal spike in CPU, I may want to check which processes are consuming most of the CPU.
Windows Event/Application Viewer
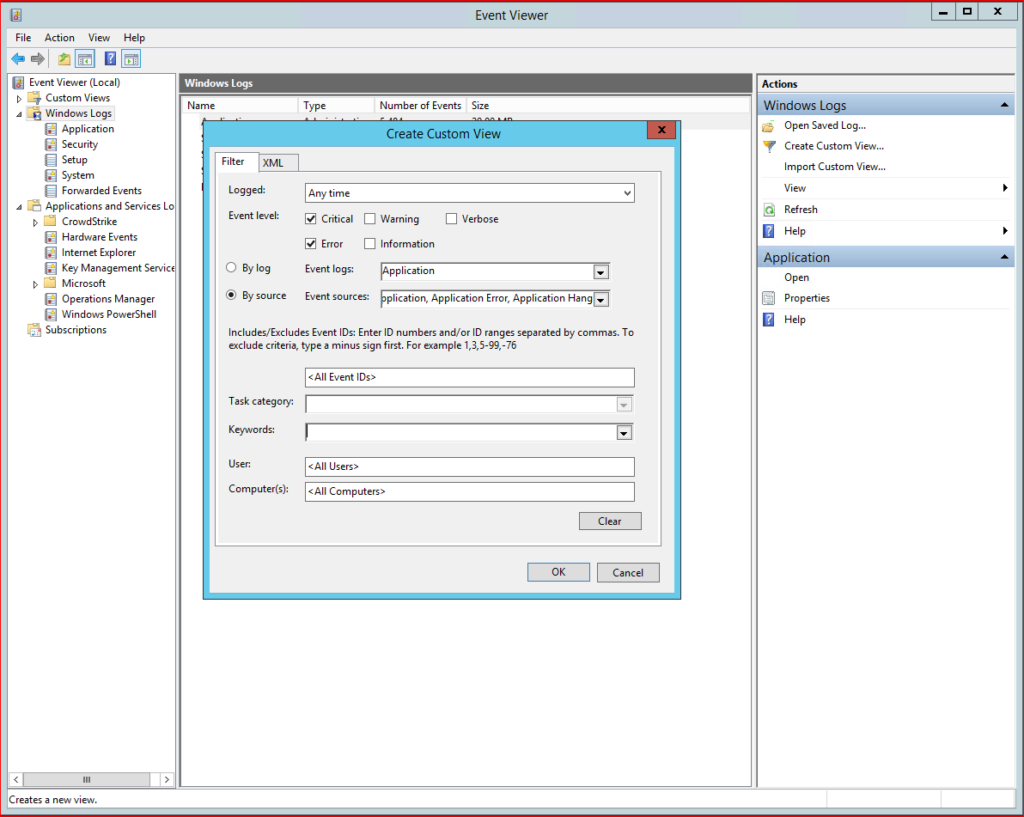
Just like the Task Manager, the Windows Event Viewer holds rich information about your application server. You may want to check if there are errors that occurred at the same time the application was experiencing slow performance. So, I would check the Application Log and even the System Log for any significant Error or Critical Events such as failed processes.
You can create a Custom View for specific applications or services that you want to track.
sp_whoisactive
So far, the two tools above may at least give you a hint of what’s going on behind the scene; or, hopefully, they will lead you to the culprit or culprits of the slow performance issue. If you think that neither the application nor the server itself is the source of the problem, you may want to ask, what is currently running on the SQL Server.
A simple sp_whoisactive query might reveal a long-running stored procedure:
EXEC sp_whoisactive @get_locks = 1 , @get_task_info = 2;
And I would run a quick check on any of the session ID’s that might be of interest:
DBCC INPUTBUFFER(13);
Are there any blocking issues? Deadlocks maybe? Do you have a session that’s been running for say, 6 hours? Are there any orphan sessions, like runaway sessions that kept running even after the process that called them have already been terminated?
If it’s a blocking issue, check the blocker and its victim. Well, if the worst comes to the worst:
KILL 13;
Dynamic Management Views
Or if you are using SQL Server 2016 or newer, you can use the new DMV sys.dm_exec_input_buffer instead of the DBCC command above:
SELECT * FROM sys.dm_exec_input_buffer(13,0)
You can join this info with other dynamic view objects to get more information about the running processes, like:
SELECT r.session_id,
 r.start_time,
 t.text,
 r.status,
 r.blocking_session_id
FROM sys.dm_exec_requests r
 CROSS APPLY sys.dm_exec_input_buffer(r.session_id, 0)
 CROSS APPLY sys.dm_exec_sql_text(r.sql_handle) AS t
WHERE r.session_id IN ( 12, 13, 14 );
SQL Profiler / Trace / Extended Events
Hopefully, at this point, the above options might have led you to the problem and the root cause of that problem. If not, then you can probably capture a trace of the event or processes using SQL Server Profiler. Please take note, though, that SQL Server Profiler is now deprecated in SQL Server 2016 and replaced with Extended Events.
Next Steps
Well, if none of those work, then the next step would be to dive deeper into the following:
Waits – Wait Stats can show you where it hurts.
Statistics – Outdated SQL Server Statistics can cause performance issues.
Indexes – Index is not always the answer for slow queries but they are a big deal in SQL Server or any other RDBMS for that matter. Sp_BlitzIndex is a good tool to check if you have sufficient and effective index structures.
Execution Plans – This is a good tool to diagnose your queries. If you want insights into your queries and the cost they incur at every step of the way, then understanding how the Execution Plans work is critical.
IO’s and Memory Grants – If you’re feeling techy, you may dig deeper and look into IO Latency and pending memory grants.
I hope that helps. If you have tips and tricks about performance tuning, you can share them below in the comments.
Enjoy!
The post Layman’s Guide to Performance Tuning appeared first on SQL, Code, Coffee, Etc..


