This is a blog post about a perennial issue. Have you ever had a call in the middle of the night about a slow webpage and you know nothing in the webpage changed?
Yeah, it’s probably parameter sniffing.
First, some clarification
All parameter sniffing is not bad. It’s usually a good thing, keeping our server’s CPU cores from wasting cycles on creating a new execution plan for each query. When SQL Server sees a query, it has to create a plan for the query it was given. It’s not the fault of your database that the old execution plan went away.
Is Parameter Sniffing causing my poor performance right now?
Oof, this is a tough question. Let’s talk about determining if parameter sniffing is occurring.
User A sends us the webpage that’s running slow and they send us the exact form that’s running slowly. We know from experience in our system that it’s the stored procedure, QueryPostType. Here’s the definition.
CREATE PROCEDURE [dbo].[QueryPostType] (@PostType INT) as
BEGIN

SELECT PostTypeId, Tags, Body
FROM Posts
WHERE PostTypeId = @PostType

END
GO
For the sake of setting expectations, we’re in the StackOverflow2010 database, and the Posts table is very skewed by PostTypeId.
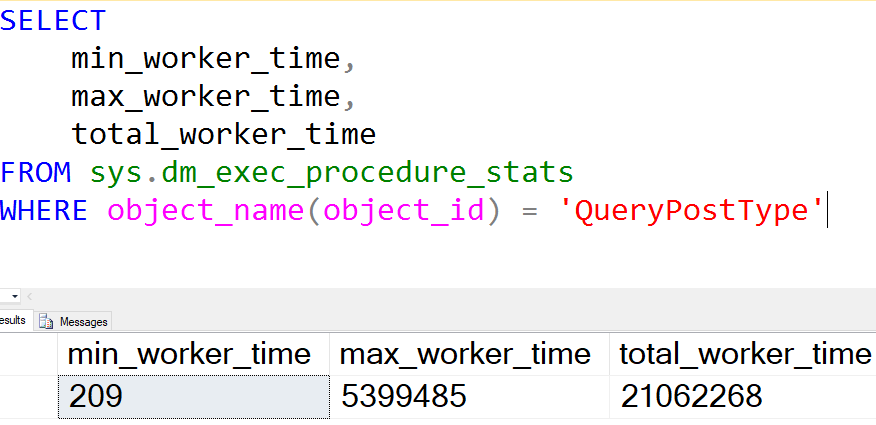
Back to the example: The user has only given us the name of the procedure, and we’re playing detective. Let’s start by looking at the plan cache information on the procedure.
SELECT
    min_worker_time,
    max_worker_time,
    total_worker_time
FROM sys.dm_exec_procedure_stats
WHERE object_name(object_id) = 'QueryPostType'
This is the first warning sign
So the procedure stats for this query have incredibly different worker time values. That’s a good sign that something is wrong. The next step is to determine what parameters created this cached plan, then we’ll see if the other warning signs line up.
Parameter sniffing is complex enough that it might take a few more posts. Stay tuned!


