By Steve Bolton
…………Professional statistical software like Minitab can fill some important gaps in SQL Server’s functionality, as I addressed in the last post of this occasional series of pseudo-reviews. I’m only concerned here with assessing how well a particular data mining tool might fit into a SQL Server user’s toolbox, not with their usefulness in other scenarios; that is why I made comparisons solely on the ability of various SQL Server components to compete with Minitab’s functionality, whenever the two overlapped. Most of the use cases for Minitab (and possibly its competitors, most which I have yet to try) come under rubric of statistics, which falls in the cracks between T-SQL aggregates and the “Big Data”-sized number-crunching power of SQL Server Analysis Services (SSAS) and SQL Server Data Mining (SSDM). For example, as I mentioned last time around, Minitab implements many statistical functions, tests and workflows that are not available in SSAS or SSDM, but which can be coded in T-SQL; whether or not it is profitable to do so varies by the simplicity of each particular stat and the skill level of the coder in translating the math formulas into T-SQL (something I’m hell-bent on acquiring). In this installment, I’ll cover some Minitab’s implementations of more advanced algorithms that we’d normally use SSDM for, but which are sometimes simple enough to still be implemented in T-SQL. So far in this haphazard examination of Microsoft’s competitors, the general rule of thumb seems to be that SSDM is to be preferred, particularly on large datasets, except when it doesn’t offer a particular algorithm out-of-the-box. That happens quite often, given that there are literally so many thousands of algorithms that no single company can ever implement them all. Minitab offers a wider and more useful selection of these alternative algorithms than WEKA, an open source tool profiled in the first couple of articles. In cases when SQL Server and Minitab compete head-to-head, SSDM wins hands down in both performance and usability. As we shall see, the same is true in comparisons of Minitab’s visualizations to SQL Server Reporting Services (SSRS), where the main dividing line is between out-of-the-box functionality vs. customizable reports.
…………Minitab’s data mining capabilities differ from SQL Server’s mainly by the fact that it implements algorithms of lower sophistication, but with a wider array of really useful variations and enhancements. The further we get from ordinary statistical tasks like hypothesis testing and analysis of variance (ANOVA) towards machine learning and other examples of “soft computing,” the more the balance shifts back to SSDM. I couldn’t find any reference in Minitab’s extensive Help files to topics that are often associated with pure data mining, like neural nets, fuzzy sets, entropy, decision trees, pattern recognition or the Küllback-Leibler Divergence. Nor is there any mention of information, at least as the term was used in the professional sense of information theory, or of the many measures associated with such famous names in the field as Claude Shannon or Andrey Kolmogorov.[1] Given that, it’s not surprising that there’s no mention of information geometry, which is apparently a bleeding edge topic in data mining and knowledge discovery. On the other hand, Minitab implements four of the nine algorithms found in SSDM, as discussed in my earlier amateur tutorial series, A Rickety Stairway to SQL Server Data Mining. Out of these four, Minitab clearly has the advantage in terms of features when it comes to Linear Regression – but definitely not when it comes to performance.
…………As depicted in Figure 1, many more types of regression are available in Minitab, like nominal, ordinal, orthogonal, nonlinear, partial least squares and Poisson. Each of these has its own set of options and parameters which greatly enhance their usefulness, most of which are not available in SSDM. For example, it is easier to access the resulting regression equations and related stats in the output of ordinary regression routines, which can return additional metrics like the Durbin-Watson Test that are not available in SQL Server at all. On top of these myriad enhancements, Minitab has entire classes of algorithms that SSDM does not provide out-of-the-box. As shown in Figure 3, many different functions can be plugged into Minitab’s version of nonlinear regression, thereby making it into an entire family of related algorithms, many of which can be quite useful in analysis. There’s no reason why Microsoft could not have implemented all of these algorithms in SSDM, but as I lamented often in the Rickety series, the top brass is slowly squandering an entire market through almost a decade of pointless neglect. It is a shame that Microsoft doesn’t know how good its own product is, given that SSDM still blows away its rivals, at least in areas where the same functionality competes head-to-head.
…………As mentioned in the last article, Minitab worksheets are limited to just 10 million rows, which means that displaying all 11 million rows in the Higgs Boson dataset[2] I’ve been using for practice data for the last couple of tutorial series is out of the question. In SQL Server Management Studio (SSMS) this is no problem, but the real issue here is not a matter of display, but of the fact that we can’t perform calculations on this many records. When I tried to run a regression on the first 10 million rows, it ran on one core for 16 minutes and ended up gobbling up 2 gigs of memory. It crashed during the loading phase before even initiating the regression calculations, with the error message: “Insufficient memory to complete operation. Minitab ran out of memory and was unable to recover. Close other applications to reduce memory and then press Retry. If this error continues you may need to exit Minitab and restart your system. If you select Abort, Minitab will terminate and you may lose work you have not saved.” In contrast, SSDM was able to run a regression on the same dataset in just 3 minutes and 54 seconds. SSDM’s version of Logistic Regression was able to process the whole table in just 3:32. Given that Minitab can’t even load that many records into a worksheet, let alone compute the regressions, the edge in performance definitely goes to SQL Server. This was accomplished without any of the myriad server options that can be used to enhance performance in SQL Server, none of which are available in Minitab; the same rule essentially holds when we compare T-SQL relational solutions to Minitab’s functionality, which doesn’t offer any indexing, tracing, tuning or other such tweaks that we take for granted. Furthermore, SSDM can better handle marking columns as inputs, outputs or both in its mining models (i.e. Predict, PredictOnly, etc.). On the other hand, SSDM lacks a good regression viewer; we’re limited to the Decision Trees and Generic Content viewers, when what we really need is a regression plot of the kind that Minitab returns out-of-the-box, like the Fitted Line Plot in Figure 4.[3] Since SSDM doesn’t implement this, I would either write a plug-in visualization of the kind I wrote about in A Rickety Stairway to SQL Server Data Mining, Part 15, The Grand Finale: Custom Data Mining Viewers, or write an SSRS report with a line graph. When mining large datasets using existing algorithms, I would first perform the calculations in SSDM, then display the regression lines in an SSRS report or custom mining viewer. I would integrate Minitab into this workflow by performing calculations on large samples of the data, in order to derive the extra regression stats it provides. In cases of small datasets, tight deadlines or algorithms that SSDM doesn’t have, I’d go with Minitab, at least in situations where T-SQL solutions would also be beyond my skill level or would take too much time to write and test.
Figures 1 and 2: The Regression and Time Series Menus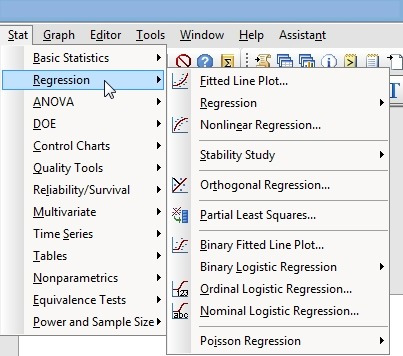
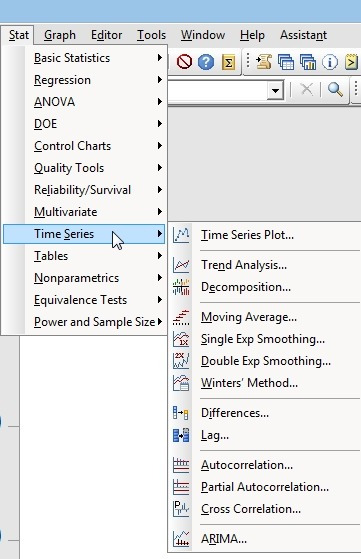
Figure 3: The Many Options for Nonlinear Regression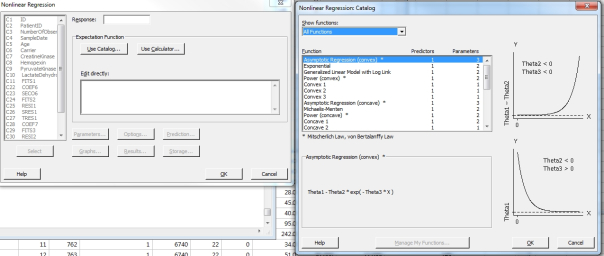
Figure 4: An Example of a Fitted Line Plot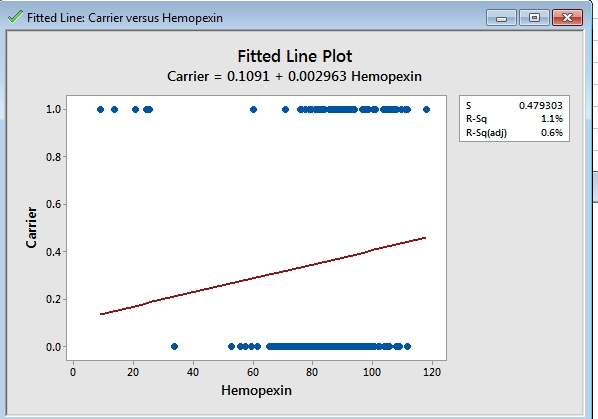
…………The same principles essentially apply to Minitab’s version of Time Series, which is also accessible through the Stat menu. Figure 2 shows that Minitab obviously provides a lot of functionality that SSDM does not, like Trend Analysis (which includes some useful Seasonal Analysis choices), Decomposition and Winters’ Method. Some of these options return accuracy measures like Mean Absolute Percentage Error (MAPE), Mean Absolute Deviation (MAD) and Mean Squared Deviation (MSD) and other stats that SSDM does not provide. One advantage is that Minitab can calculate Time Series using linear, quadratic, exponential growth and “S-Curve (Pearl-Reed logic)” models. The gap in functionality is not as wide as with regression, however, given that it is not terribly difficult to implement various types of lags, autocorrelations, differences and smoothing operations with T-SQL windowing functions that scale better. SSDM and Minitab have competing implementations of ARIMA, but I strongly prefer the Microsoft version on the strength of its user interface; the Minitab version is mainly useful for making some of the intermediate stats readily available, like the residuals and Modified Box-Pierce (Ljung-Box) results. Time Series in Minitab is hobbled, however, by the fact that it can only calculate one variable per Time Series, unlike SSDM, which can plot them all. The Minitab Time Series Plot is also bland in comparison to the Microsoft Time Series Viewer. Once again, I would use Minitab’s Time Series only to supplement SSDM with additional stats or for cases where there’s a need for alternative algorithms, like Winters’ Method. SSDM would be my go-to tool for any functionality they implement in common, especially when any serious heavy lifting is called for. For low-level stats like autocorrelation and moving averages, I would bypass Minitab altogether in favor of my homegrown T-SQL and SSRS reports.
Figure 5: How to Access Minitab’s Clustering Algorithms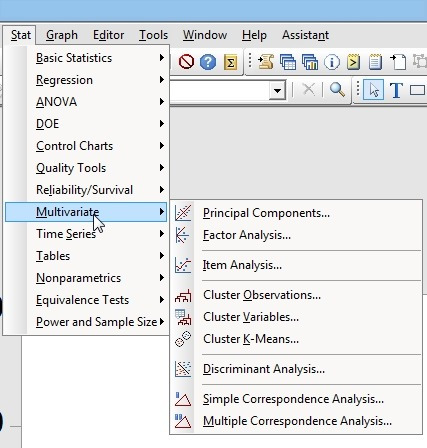
…………One of Minitab’s main strengths is that it meets some use cases tangential to data mining, such as Principal Components Analysis, Maximum Likelihood and other Multivariate items and subitems. SSDM doesn’t do any of that, but it does Clustering and it does it well. Minitab doesn’t implement the subtype I discussed in A Rickety Stairway to SQL Server Data Mining, Algorithm 8: Sequence Clustering or the Expectation Maximization (EM) method mentioned in A Rickety Stairway to SQL Server Data Mining, Algorithm 7: Clustering, but both implement the most common flavor, K-Means. There are literally thousands of extant clustering algorithms available in the research literature, each of which is useful for specific use cases, so no single product is going to be capable of implementing them all. Even if the top brass at Microsoft were fully committed to SSDM, they’d never be able to incorporate them all, which means that clustering software doesn’t necessarily compete head-to-head. In this case, Minitab has the advantage in the terms of enhancements, such as choices of Linkage Methods like Average, Centroid, Complete, McQuitty, Median, Single and Ward, or distance metrics like Euclidean, Manhattan, Pearson, Squared Euclidean and Squared Pearson. Aside from these options and a couple of related stats, however, SSDM outclasses Minitab. In terms of performance, processing a K-Means mining model on all of the columns of the 5-gigabyte Higgs Boson table only took 1:36:42 on my wheezing old development machine. As noted in the earlier discussion on regression, Minitab can’t even load datasets of this size without choking. That’s not surprising, giving that it’s intended mainly statistical analysis on datasets of small or moderate size, not heavy number-crunching on Big Data. In terms of visualization, the SSDM Cluster Viewer is light years ahead of the simple text output and dendrograms available in Minitab. Clustering is an inherently visual task, but the graphics in Figure 6 and 7 simply don’t convey information concisely and efficiently like the Cluster Viewer, which also has the advantage of being an interactive tool.
Figures 6 and 7: Sample Session Output and Dendrogram for Minitab Clustering
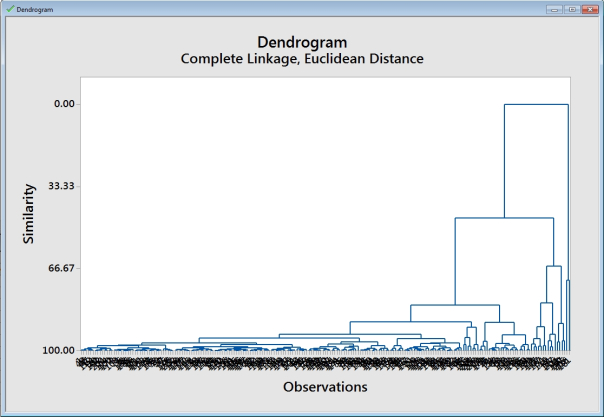
Figure 8: The Minitab Graph Menu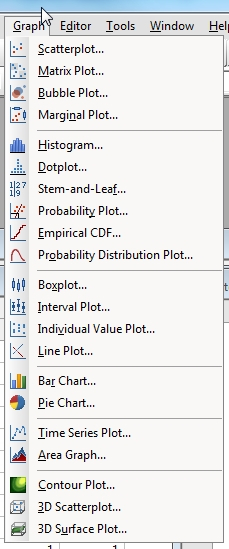
…………Many of the individual statistical tests, functions, algorithms and Assistant workflows return various plots in separate windows, alongside the data returned in the worksheets and text output in the Session window. Most of these scattered visualizations are collected in the Graph menu depicted above, or can be found in the Graphical Analysis Assistant mentioned in my last post. Other common visualizations like run charts and Pareto charts are available from the Quality Tools menu, while the Control Charts item on the Stat menu provides access to plots for some simple stats like moving averages. The advantages of all of the above can be summed up in one word: convenience. They’re all implemented out-of-the-box, thereby eliminating the need to write your own reports. On the other hand, someone with the skill to code their own SSRS reports will quickly find themselves chafing at the limitations of these canned graphics, which offer less in the way of customization. For example, the Line Plot…command implements a graphic not available out-of-the-box in SQL Server, which allows users to view associations across the variables in dataset. It quickly becomes cluttered when there are many distinct values, which is an obstacle that SSRS could deal with far more efficiently by programmatically changing such colors, shapes, sizes and so forth of the graphic elements as needed. Users are basically stuck with the format Minitab provides, with some minor customizations available through such means as right-clicking the graphic elements, as in the sample histogram in Figure 9. Sometimes that’s good enough to get the job done; whether or not it suffices for a particular analyst’s needs is in part dictated by the data and problems at hand, and in part is a highly individual choice dependent on their skills.
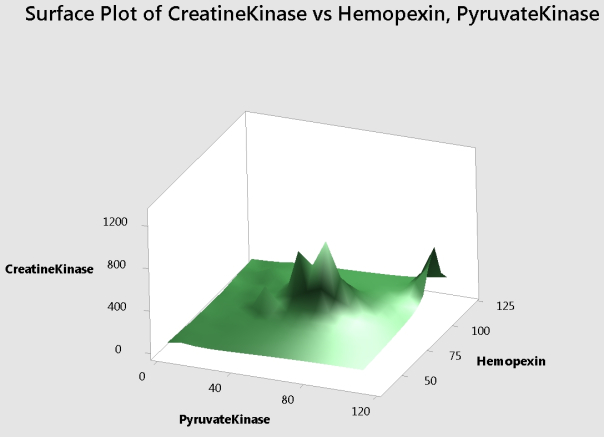
…………The Dotplot is rather ugly and the Stem-and-Leaf is output as text; coding the latter in T-SQL and hooking it up to Reporting Services isn’t terribly difficult but looks much better, as I’ve discovered first-hand. Histograms can be returned with many of the statistical functions mentioned in my last blog post, plus many of the mining algorithms mentioned here. As I demonstrated in Outlier Detection with SQL Server, part 6.1 – Visual Outlier Detection with Reporting Services though, these can be implemented fairly quickly in SSRS with a lot more eye candy and customizability. Probability plots are also returned by many functions and tests, but only for certain distributions, like the Gaussian (i.e. “normal”), lognormal, smallest extreme value, largest extreme value and various takes on the log-logistic, exponential, gamma and Weibull. I will demonstrate how to include some of these in SSRS reports in a future article on goodness-of-fit testing with SQL Server. The concept of empirical distribution functions (EDFs) will also be introduced in articles on the Kolmogorov-Smirnov and Lilliefors Tests in that future series. I like their Matrix Plots, but it’s nothing that can’t be done in SSRS. The scatter, bubble, bar and pie charts are all definitely inferior to their SSRS counterparts, as are the 3D versions of the scatter plot. I prefer SSDM’s Time Series visualizations to Minitab’s, although that’s more of a judgment call. I figured that the box and interval plots would have an advantage over SQL Server reports in its ability to overcome the display issues I mentioned in Outlier Detection with SQL Server, part 6.2: Visual Outlier Detection with Box Plots in Reporting Services. Basically, SSRS only allows one resultset from each stored procedure, thereby limiting its ability to display summary statistics alongside individual records without doing client-side calculations – which just isn’t going to happen on cubes, mining models and Big Data-sized relational tables. Unfortunately, I received my first crashes on both, on a practice dataset of just 1,715 records; Minitab started running on one core (no others were in use), with no discernible disk activity and no growth in memory usage; in fact, I had to kill the process after a couple of minutes, given that the memory use wasn’t budging at all. There is apparently no Escape command in Minitab, which is something that really comes in handy in SQL Server for runaway queries. The area, marginal, probability distribution and individual value plots are just really simple special cases of some of these aforementioned plots, so I’ll skip over them. Perhaps the only two Minitab visualizations I’d use for any purpose other than convenience are the interval plots mentioned above, plus the contour and 3D surface plots depicted below. The latter has some cool features, such as wireframe display.
Figure 9: An Example of a Minitab Histogram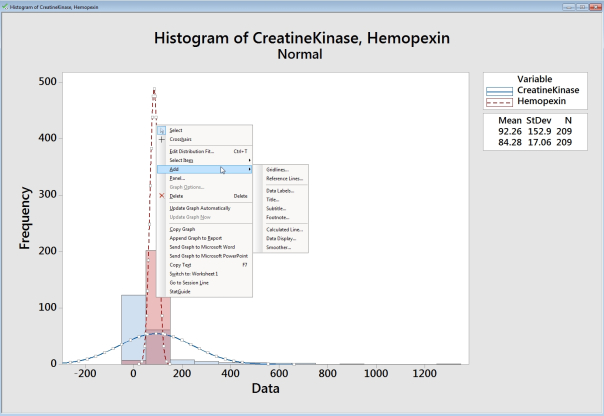
Figures 10 and 11: Examples of Contour and 3D Surface Plots in Minitab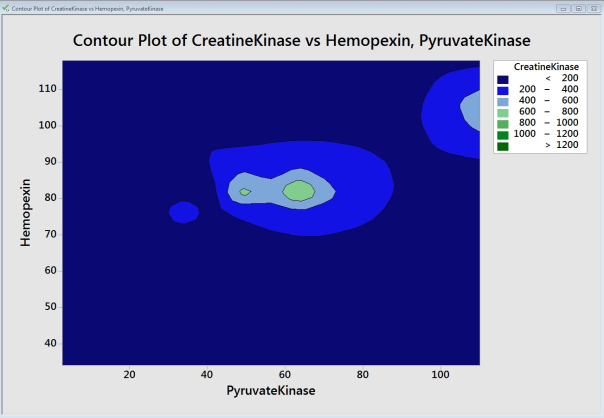
…………It is good to keep in mind when reading these pseudo-reviews that I’m an amateur posting my initial reactions, not an expert with years of experience in these third-party tools. In the case of Minitab, we’re talking about an expensive professional tool with many nooks and crannies I never got to explore and a lot of functionality I’m not familiar with at all, like the Six Sigma and other engineering-specific tools I mentioned in the last article. I barely scratched the surface of a very big topic. That became crystal clear to me when writing these final paragraphs, when I discovered quite late in the game that more customization was available through that context menu in Figure 9. I’ve undoubtedly short-changed Minitab somewhere along the way, as I’m sure I did with WEKA a few articles ago. These articles are intended solely to provide introductions to these tools to SQL Server users, not expert advice to a general audience. Based on this limited experience, my general verdict is that I’d use Minitab as a go-to tool for functionality that SQL Server doesn’t provide out-of-the-box, like ANOVA, discriminant analysis, hypothesis testing and some of the alternative mining algorithms mentioned in this article. This is especially true when speaking of the helpful workflow Assistants Minitab provides for such tasks, particularly hypothesis testing and the unfamiliar engineering processes.
…………The less complex the functionality is, the more I’d lean towards T-SQL solutions, while the more complicated the underlying formulas become, the more I’d lean towards SSDM. Whenever SQL Server competes with Minitab head-on, it wins hands down, except in the area of supplemental stats; if only Microsoft had updated SSDM regularly over the years instead of abandoning the market, it might have been able to extend this advantage over Minitab to additional areas. This advantage is twice as strong whenever performance, tracing, higher precision data types and tweaks like indexing are paramount. In terms of graphical capabilities, Minitab’s edge is in convenience, whereas SSRS definitely offers more power. Because the human mind processes most of its information visually, eye candy cannot be overlooked as a key step of conveying the complex information derived from mining tasks to end users. Perhaps Excel would be a worthy competitor in Minitab’s bread-and-butter, which is performing kinds of common statistical tests that lay somewhere between the simple aggregates of T-SQL and the sophistication of SSDM algorithms. I’m ignorant of a lot that goes on with Excel, but it seems like more of a general purpose spreadsheet than Minitab, which is a specialized program that just happens to use a spreadsheet interface; it’s no accident that I’ve so far found easier to use for statistical testing, given that this is its raison d’etre.
…………Perhaps there are other statistical packages that would perform the same tasks in a SQL Server environment much better than Minitab; maybe I will run into a competitor that performs the same functions at half the price tomorrow. Until then, however, I will leave Minitab a big space in my toolbox in comparison to WEKA, which in turn outperformed the sloppy Windows versions of DB2 and Oracle, as I discussed in Thank God I Chose SQL Server part I: The Tribulations of a DB2 Trial and Thank God I Chose SQL Server part II: How to Improperly Install Oracle 11gR2. Data mining is a taxing topic that simply doesn’t leave much time and mental energy left for the hassles of unprofessional interfaces. Usability is one of the many categories I will take into consideration throughout this occasional, open-ended series, along with performance, the quality and availability of algorithms, visualizations, documentation, error-handling and crashes and portability, not to mention security, extensibility, logging and tracing. I have many of Minitab’s competitors in my cross-hairs, including RapidMiner, R, Pentaho, Autobox, Clementine, SAS and Predixion Software, a company founded by SSDM developers Jamie MacLennan and Bogdan Crivat. Which one I will examine next is still up in the air, nor do I know what I’ll find when I finally try them out. My misadventures with DB2 and Oracle taught me not to delve into these topics with preconceived notions, because there are surprises lurking out there in the data mining marketplace – such as the Cinderella story of WEKA, the free tool which beat DB2 and Oracle hands-down in terms of reliability. The most pleasant surprise with Minitab was how smoothly the GUI interface worked, making it trivial to perform many advanced statistical tests effortlessly.
[1] Kolmogorov is only mentioned in connection with the Kolmogorov-Smirnov goodness-of-fit test.
[2] I downloaded this last year from the University of California at Irvine’s Machine Learning Repository and converted it to a SQL Server table of about 5 gigs, which now resides in the sham DataMiningProjects database I’ve been using for practice purposes for the last few tutorial series.
[3] This example displays data from the same Duchennes muscular dystrophy dataset I’ve been using as practice data for the last several tutorial series, which I downloaded ages ago from Vanderbilt University’s Department of Biostatistics.


