Who are your worst offenders? By offenders I mean, queries that are consuming the most resources on your server(s).
I know Extended Events have a lower impact but I like server side traces. Not only because once you’ve set one up, setting up others is very simple but also because there’s a really good tool called ClearTrace that can be used to analyse the output.
I’ll cover using Extended Events in a future blog post.
So let’s go through a server side trace. First create the trace:-
DECLARE @TraceIDINT
DECLARE @MaxFileSizeBIGINT = 52
DECLARE @EndTimeDATETIME = DATEADD (hour, 24, getdate());
DECLARE @FileNameNVARCHAR(200) = '<TRACE FILEPATH>'
DECLARE @optionsINT = 0

EXEC sp_trace_create
@traceID OUTPUT,
@options= @options,
@tracefile= @FileName,
@maxfilesize= @MaxFileSize,
@stoptime= @EndTime

PRINT @TraceID
Full details on the sp_trace_create stored procedure can be found here:- http://technet.microsoft.com/en-us/library/ms190362.aspx
The script above has created a trace, with a file in the specified location that will be a maximum size of 52MB and will run for 24 hours.
Store the output of PRINT @TraceID and replace in the following scripts with the value.
Next set the events that the trace will capture:-
--RPC:Completed [EventID 10]
EXEC sp_trace_setevent <TraceID>, 10, 1,  1 --TextData
EXEC sp_trace_setevent <TraceID>, 10, 2,  1 --BinaryData
EXEC sp_trace_setevent <TraceID>, 10, 6,  1 --NTUserName
EXEC sp_trace_setevent <TraceID>, 10, 9,  1 --ClientProcessID
EXEC sp_trace_setevent <TraceID>, 10, 10, 1 --ApplicationName
EXEC sp_trace_setevent <TraceID>, 10, 11, 1 --LoginName
EXEC sp_trace_setevent <TraceID>, 10, 12, 1 --SPID
EXEC sp_trace_setevent <TraceID>, 10, 13, 1 --Duration
EXEC sp_trace_setevent <TraceID>, 10, 14, 1 --StartTime
EXEC sp_trace_setevent <TraceID>, 10, 15, 1 --EndTime
EXEC sp_trace_setevent <TraceID>, 10, 16, 1 --Reads
EXEC sp_trace_setevent <TraceID>, 10, 17, 1 --Writes
EXEC sp_trace_setevent <TraceID>, 10, 18, 1 --CPU
EXEC sp_trace_setevent <TraceID>, 10, 35, 1 --DatabaseName

--SQL:BatchCompleted [EventID 12]
EXEC sp_trace_setevent <TraceID>, 12, 1,  1 --TextData
EXEC sp_trace_setevent <TraceID>, 12, 2,  1 --BinaryData
EXEC sp_trace_setevent <TraceID>, 12, 6,  1 --NTUserName
EXEC sp_trace_setevent <TraceID>, 12, 9,  1 --ClientProcessID
EXEC sp_trace_setevent <TraceID>, 12, 10, 1 --ApplicationName
EXEC sp_trace_setevent <TraceID>, 12, 11, 1 --LoginName
EXEC sp_trace_setevent <TraceID>, 12, 12, 1 --SPID
EXEC sp_trace_setevent <TraceID>, 12, 13, 1 --Duration
EXEC sp_trace_setevent <TraceID>, 12, 14, 1 --StartTime
EXEC sp_trace_setevent <TraceID>, 12, 15, 1 --EndTime
EXEC sp_trace_setevent <TraceID>, 12, 16, 1 --Reads
EXEC sp_trace_setevent <TraceID>, 12, 17, 1 --Writes
EXEC sp_trace_setevent <TraceID>, 12, 18, 1 --CPU
EXEC sp_trace_setevent <TraceID>, 12, 35, 1 --DatabaseName
Full details on the sp_trace_setevent stored procedure can be found here:- http://technet.microsoft.com/en-us/library/aa260314(v=sql.80).aspx
The scripts above will set the trace to capture the events RPC:completed & SQL:BatchCompleted. It will capture the TextData, BinaryData, NTUserName, ClientProcessID, ApplicationName, LoginName, SPID, Duration, StartTime, EndTime, Reads, Writes & CPU columns of each event.
Then filter the events:-
DECLARE @Value BIGINT = 500000

EXEC sp_trace_setfilter 2, 16, 0, 4, @Value
Full details on the sp_trace_setfilter stored procedure can be found here:- http://technet.microsoft.com/en-us/library/aa260322(v=SQL.80).aspx
The script above will filter all events captured, only retaining queries that perform over 500,000 reads. The trace can then be started:-
EXEC sp_trace_setstatus <TraceID>, 1
Whilst the trace is running it can be queried it by running the following:-
SELECT TOP (10)
DatabaseName, LoginName, ApplicationName, Starttime, Endtime,
((Duration/1000)/1000)/60 AS [Duration (mins)], Reads,
TextData
FROM
fn_trace_gettable('<TRACE FILEPATH>', DEFAULT)
ORDER BY
reads DESC;
GO
You can also get information on the traces running on the server:-
SELECT TraceID, Property, Value FROM ::fn_trace_getinfo(DEFAULT);
GO
Once the trace has completed, ClearTrace can be used to analyse the output:- http://www.scalesql.com/cleartrace/
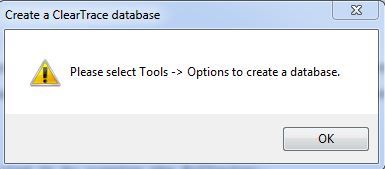
Download the .zip and extract the .exe. The program doesn’t require an install so double click and the program will ask you to setup the database connection:-
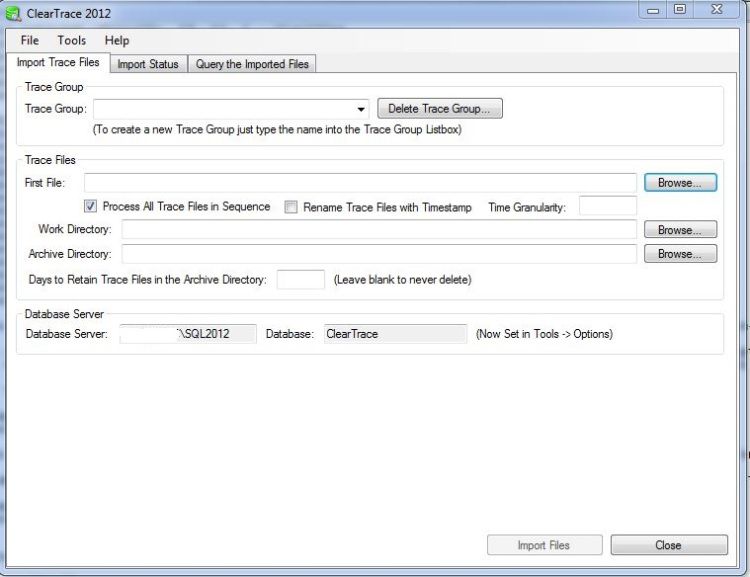
Click on OK, then go to Tools > Options and enter the details of the server and database and then click Save.
On the main screen, click Browse to navigate and then select your trace file. Click on OK and then Import Files.
Wait for the import to finish (which can take some time if it is a large file).
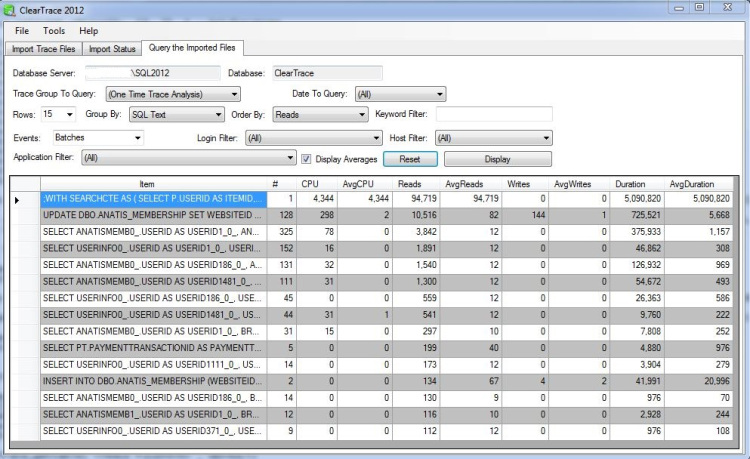
You then have several options for viewing the data. I won’t go through them all but I always tick the Display Averages box and start off by ordering by Reads.
And there you have it! The program gives a quick and easy way to view the most expensive queries captured allowing you to see what is happening on your server.


