One of the common goto methods for query specific slowness which can be replicated via an application can be to start up a trace or extended events session whilst replicating the issue, we all know about the dangers of running these sessions without sufficient filtering so ensuring that correct filtering is applied and sessions are monitored whilst running for short periods of time can really help identify exactly what the app is doing during replication of the issue.
But what exactly is a slow running query? over 1 second? over 2 seconds? well it all depends, In the past I have had to dig into trace files provided to me that were ran for the duration of a user replicating slowness within an application, one mistake I used to make was looking straight for the high duration queries. I would load the trace file and straight away add a filter on the duration column for something trivial such as greater than 50ms, bad idea! if I was lucky I may have found the slow running culprit/s but more often I found the issue to be somewhat hidden at first glance.
Its always worth checking for repeated calls, what if there is a stored procedure that runs for 50ms but is called over and over again with the only change being the parameter value passed, 100 calls to that proc soon becomes 5 seconds! and that’s not taking into account what I call round trip (please don’t beat me up over the terminology  ) what I call round trip is the time it takes from completion of a call to SQL to the beginning of the next call, lets say for arguments sake that it takes 10ms per call to call the next one.

Query: 50ms x 100 calls = 5000ms
Round trip: 10ms x 100 calls = 1000ms
That’s another second! we are now looking at a total of 6 seconds, the above is just an example of how it works you could of course focus some effort on making the proc faster but 50ms is already quick! I would imagine that in this case you may want to focus you efforts on why the proc is being called 100 times in the first place as you may find that you are on the wrong end of an object oriented dev with limited SQL knowledge who just loves to loop!
I know I joke but I have seen this approach and its not pretty, especially when the procedure is so simple and it could have been called just once without the parameter and then the results dealt with inside of the app.
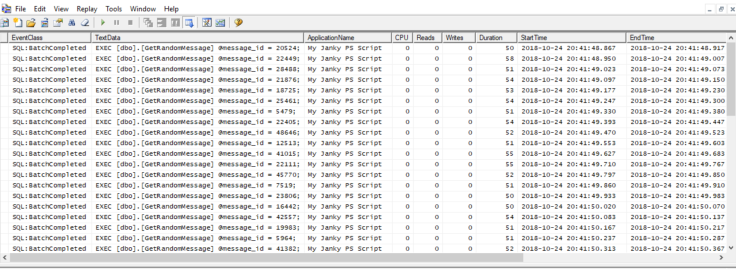
So back to the topic of the round trip below is an example of some really janky code I wrote in powershell It will connect to my SQL instance and perform a bunch of calls to a stored procedure but I have made the powershell script force a small wait in between calls, I will then demonstrate what this looks like in profiler and furthermore how you can query the results to identify issues with roundtrip.
$Counter = 0
$Connection = New-Object System.Data.SqlClient.SqlConnection
$Connection.ConnectionString = "Data Source=SQL02;Database=SQLUndercoverDB;Application Name=My Janky PS Script;Integrated Security=sspi"

$Connection.Open()

While ($Counter -le 50){
$RandomParam = Get-Random -Minimum 21 -Maximum 49959
$Query = "EXEC [dbo].[GetRandomMessage] @message_id = $RandomParam;"
$ExecuteQuery = $Connection.CreateCommand()
$ExecuteQuery.CommandText = $Query
$ExecuteQuery.ExecuteScalar()
$Counter += 1
$RandomDelay = Get-Random -Minimum 10 -Maximum 30
Start-Sleep -Milliseconds $RandomDelay
}

$Connection.Close()
Yes it’s bad code! I am not a PS wizz
A little proc just for demo purposes:
CREATE PROCEDURE [dbo].[GetRandomMessage]
(
@message_id INT
)
AS
BEGIN
SELECT text
FROM sys.messages
WHERE message_id = @message_id

WAITFOR DELAY '00:00:00.050'
END
Here is a look at the Trace I was running:

Now I will save the trace file contents to a table within SQL
I know I could have included the save to table option in the trace definition in the first place but I just wanted to demonstrate that it can be done after too.
With all my trace data stored inside a table in SQL I am now able to do some better analysis, for this demo its easy to see in the trace but when you have a trace file that has lots of different calls it can be difficult to see.

As you can see the total duration in this example was 3.9 seconds with almost 50% of the time waiting on the client, of course these sorts of numbers could be completely normal for you so its up to you to determine what can be deemed as slow.
Here are the queries I used:
--Shoe raw data including Roundtrip per call and Duration per call
SELECT [RowNumber]
      ,[TextData]
      ,[StartTime]
      ,[EndTime]
      ,DATEDIFF(Millisecond,LAG(EndTime,1,StartTime) OVER (ORDER BY [RowNumber] ASC),StartTime) AS Roundtrip
  ,[Duration] / 1000 AS QueryDuration
      --,[NTUserName]
      --,[LoginName]
  FROM [dbo].[RoundTripDemo]
  WHERE TextData IS NOT NULL --Using to filter my trace start and finish rows

SELECT
SUM(RoundTrip) AS RoundTrip,
SUM(Duration) AS QueryDuration,
SUM(RoundTrip)+SUM(Duration) AS TotalDuration
FROM
(
SELECT
RowNumber,
Duration/1000 AS Duration,
StartTime,
EndTime,
DATEDIFF(Millisecond,LAG(EndTime,1,StartTime) OVER (ORDER BY RowNumber ASC),StartTime) AS RoundTrip
FROM [dbo].[RoundTripDemo]
WHERE TextData IS NOT NULL --Using to filter my trace start and finish rows
) as Roundtripdata
Of course with all this in mind please do not just assume that the round trip could be the app, it could also be network related slowness or perhaps you have a middle tier setup that relays out to the client and vise versa this would add more complexity to you investigations however the purpose of this exercise is purely to identify if there is an issue outside of the queries themselves.
Thanks for reading


