Recently I had a client complain of chronic high CPU utilization. The performance of their SQL Server had degraded, and it appeared to be related to higher than normal CPU utilization in conjunction with symptoms of unresponsive user queries. The root cause was twofold—a third party hosting provider had overallocated virtual processors on the physical host where the virtual machine (VM) running SQL Server was residing, as well as a recent upgrade from a version of VMWare that was not patched for Spectre and Meltdown. The host had 16 physical cores and was hyperthreading (making it effectively 32 cores) until the hosting provider patched from VMWare 5.5 to a newer release (we believe 6.5) which was required for Meltdown and Spectre processor vulnerabilities. This patch disabled hyperthreading from the hypervisor to mitigate the security risk from speculative execution. Note, this patch is over a year old and a critical security risk; most software vendors (including VMWare) put this out as an immediate requirement after the announcement of the vulnerabilities.
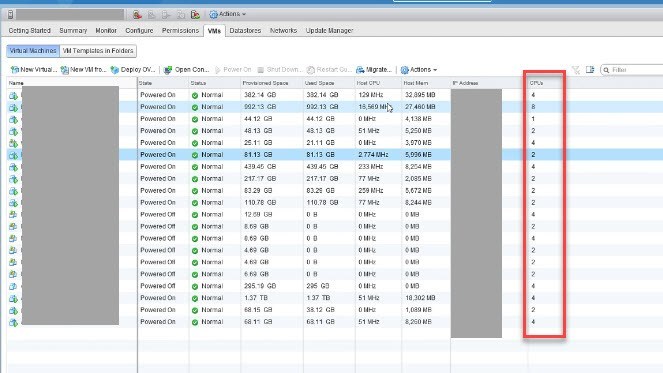
Given this was a virtual machine, it shared a physical host with many other VMs; this is a very common configuration. However, this host was VERY overallocated. As mentioned above, there were 16 cores–however 61 additional vCPUs had been allocated to other machines. That’s 4.3 times the number of CPUs available for allocation. The screenshot below shows this singular Host, highlighting the vCPUs allocated.
The most prevalent SQL Server wait type was SOS_SCHEDULER_YIELD. This wait type is typically prevalent on a server undergoing CPU pressure. Whenever a thread needs a resource that it can’t immediately acquire, that worker thread becomes suspended and waits on the Waiter List to be told (signaled) that its resource is available. When this is encountered on a VM, it is commonly associated with overallocation of CPU on the underlying host, particularly when they happen suddenly in your environment. The VM was struggling to get and use the 16 vCPUs required for the workload from the host. According to their hosting provider it is their practice to over allocate their VM hosts. After speaking with them, we explained that this is in fact not a common practice and in this case was the very root of the issue. As a fix they moved the VM to a dedicated host. This immediately made a difference in CPU performance. Jonathan Kehayias (B|T) has two great blogs on CPU pressure I referred to while working through this issue. You can find them here and here.
The final solution was a combination of the move to a dedicated older server with appropriate vCPU allocation, query tuning, indexing and best practice configuration changes on the server. The following SQL Server settings were changed: Max Degree of Parallelism, Cost of Parallelism Threshold, Max Memory, and Tempdb file configuration and sizing. Additionally, Trace flags (1118, 1117, 2371 and 4199), Optimize for Adhoc Workloads and Instant File Initialization settings were enabled. Once best practices were configured, I tuned 26 query plans and adjusted indexes appropriately according to their needs thus reducing the I/O and CPU needs.
The moral of the story is, sometimes performance is impacted by things outside of SQL Server. After you make sure SQL is optimized and you are still having issues, start looking to the VM host. When you experience weird SQL performance on a VM, you always want to look at the host to see the rest of the environment (if you are in the cloud this is easier—everything is tightly managed with quality of service (QoS). Ask these questions.
- Was the Host patched recently?
- Was this VM vMotioned to another Host?
- Is the memory allocated to the VM “reserved”?
- What is the CPU allocation on the Host?
- Any config changes on the Host?
- What does Ready Time report show on the Host? (link is to a great blog by David Klee (B|T))
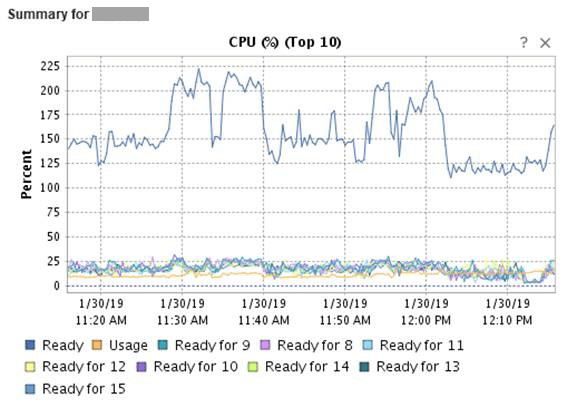
The last question in my list above regarding Ready Time really helped me in proving over allocation to the VM Administrator and ultimately lead to host modifications. Ready Time is a metric on the VM Host that shows the percentage of time the virtual machine was ready but could not get scheduled to run on the physical CPU. As you can see in the screenshot above the Host had a VERY high Ready time which was a clear indication of over allocation. Typically, you want to see a ready time under 5%. If it’s higher than this, you should really investigate further.
When facing high CPU pressure take the time to not only performance tune SQL Server but look the Host it’s residing on. You may find that outside factors are affecting the VM beyond SQL’s control. Being a great DBA is not only managing your SQL Servers but also knowing all the players involved in performance.


