It is relatively easy to spot CPU-bound system. But, the source of CPU pressure is not always easy to pinpoint. The CPU can be driven by many factors on the server such as;
- Memory pressure which is causing SQL Server to continually move data in and out of the memory.
- Disk latency
- Bad indexes
- Poorly written queries
- Insufficient number of CPUs on the box
- Maybe a non-SQL Server process running on the server
Regardless of what caused the CPU problem, you as DBA has to figure out the reason for excessive CPU utilization in SQL Server.
In recent time, I was analyzing the health of one of the very critical OLTP SQL Server Instance. The Instance was processing 4500+ transactions per seconds. During the health checkup, I noticed the physical server was hitting the CPU continuously somewhere between 35% to 45%. As the server got massive workload, therefore I quickly verify the number of the CPUs to make sure that the server got enough CPU to handle the workload.
CPU specification – 4 Physical CPU sockets, 64 physical cores, and 128 logical cores:. This is how the CPU utilization looks like on the server.
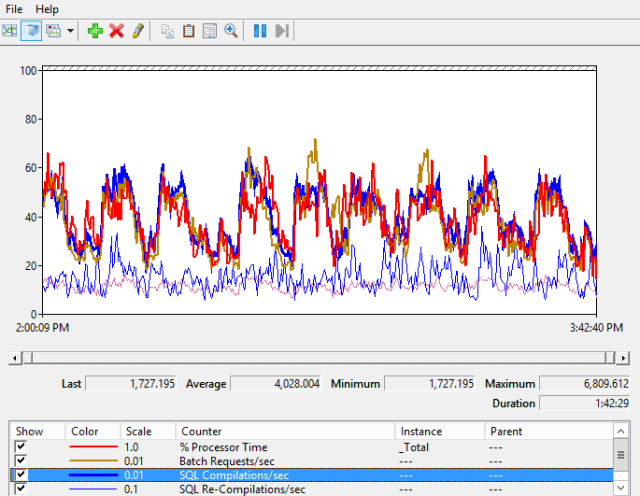
After seeing the CPU specs, I was wondering what was contributing to CPU. So, I started figuring out all possible reasons for excessive CPU utilization. At a point, I decided to enable the perfmon counter and below is what I found.
Yes! You are seeing evidence of an excessive number of query compilations in SQL Server where SQL Compilation/sec counter (highlighted in Blue) has a value that is almost similar to Batch Request/sec (highlighted in Gold).
Note: SQL Compilation should be less than 10% of Batch Request/sec.
It means every batch is being compiled before execution. We now know that the CPU utilization of the server is majority used for SQL Compilation and very little is used to execute the queries itself.
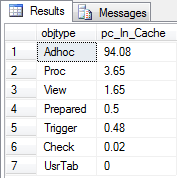
To understand the proportion of plans (ad-hoc, prepared, and other categories) in the cache, I checked cached plan profile by running the following code.
Profiling the Plan Cache
DECLARE  @sumOfCacheEntries FLOAT = ( SELECT COUNT(*) FROM sys.dm_exec_cached_plans )
SELECT  objtype,
   ROUND((CAST(COUNT(*) AS FLOAT) / @sumOfCacheEntries) * 100,2) [pc_In_Cache]
FROM  sys.dm_exec_cached_plans p
GROUP BY objtype
ORDER BY 2 desc
The output of plan cached profiling confirmed that the production server is experiencing typically single used plan that’s why we see 94 % of ‘adhoc’ plans in the cache.
Here is another way to identify the percentage of all compiled plans in the cache – “Single Used Plan Count” Vs “> Single Used Plan Count”
DECLARE @singleUse FLOAT, @multiUse FLOAT, @total FLOAT
SET @singleUse = ( SELECT COUNT(*)
     FROM sys.dm_exec_cached_plans
     WHERE cacheobjtype = 'Compiled Plan'
     AND usecounts = 1)
SET @multiUse =  ( SELECT COUNT(*)
     FROM sys.dm_exec_cached_plans
     WHERE cacheobjtype = 'Compiled Plan'
     AND usecounts > 1)
SET @total = @singleUse + @multiUse
SELECT 'Single Used Plan Count'  as Matrix, ROUND((@singleUse / @total) * 100,2) [percentage_distribution_of_plan_usecount]
UNION ALL
SELECT '> Single Used Plan Count', ROUND((@multiUse / @total) * 100,2)
A massive 96.8% of the plans in my scenario had just a single used plan count.
To figure out the problematic queries which are bloating the plan cache and also causing high CPU, I ran the following query;
Pulling out the Problematic Queries
SELECT
         a.execution_count ,
         OBJECT_NAME(objectid, b.dbid) as object_name,
         query_text = SUBSTRING(b.text, a.statement_start_offset/2,
(   CASE WHEN a.statement_end_offset = -1
THEN LEN(CONVERT(nvarchar(MAX), b.text)) * 2
                                        ELSE a.statement_end_offset
                                        END - a.statement_start_offset
                                      )/2
                                ) ,
                                dbname = DB_NAME(b.dbid),
                                a.creation_time,
                                a.last_execution_time
FROM            sys.dm_exec_query_stats a
CROSS APPLY     sys.dm_exec_sql_text(a.sql_handle) AS b
where execution_count =1
The output of the query indeed surprised. A tremendous number of single plans were bloating in the plan cache because of dynamic query. Kindly look the following image
Summary
If you find the same scenario in your environment, you can follow the below steps to address the problem;
- Track down the offending queries and highlight to application team so they can re-write re-usable code.
- You can think of enabling the option “Optimize For Ad-hoc Workloads”. But, you must do a thorough testing before apply in the production.
- You can also enable force parameterization at the database level. It will be applied to all queries. But again, you need to do through testing before using in the production.
Reference: https://bit.ly/2GxyeIH
I hope this blog helps you to have a commanding understanding of – How SQL Compilation Can Prove the Server CPU.
The post How SQL Compilation Can Prove the Server CPU appeared first on .


