Update: There is a new 1.7 Version of Google Analytics Source for SSIS
 In the modern age of the technology, almost everyone owns a site or two, and most certainly every business does. Every site is a major source of data, data which can be used for better understanding of the visitors and their preferences. Analytics.
In my opinion, there are 2 basic types of analytics platforms that people are using on the web currently – Google Analytics and others.
Under others I mean that the overall popularity of the first one made them all to be in the 2nd category. This all includes some very interesting open source platforms, such as Piwik (http://piwik.org)
Using Google Analytics via Web Browser is a very common thing, and a lot of people do that on a daily (and some on hourly basis), and so playing & doing basic analysis of the information inside Google Analytics interface is a very accessible & easy thing.
For those looking to export analysed data, it is easy to do with an “export” button which allows to have data exported into CSV, TSV, TSF for Excel, Excel, Google Spreadsheets, as well as into PDF.
This is really awesome, isn’t it ? 
Well, my answer is yes & no. I can’t imagine anyone wanting to go into Google Analytics interface daily in order to export that information into CSV, copy it into some folder, open your preferred integration tool (mine is definitely SSIS :)), and then execute process for integrating this data into their Analytical platform or DatawareHouse.
Would not it be nice, if there would be an automated plugin for automating those tasks allowing you to configure this type of information once and then simply import it into your preferred system ?
Guess what – there is a such plugin:
SSIS GoogleAnalyticsSource is the plugin that you might have been searching desperately!
Developed by my colleague Tillmann Eitelberg from OH22 in his own free time, this is one more cool gift for the global community.
SSIS GoogleAnalyitcsSource is an open source plugin for SSIS which allows you to read data inside your Data Flow directly from Google Analytics.
SSIS GoogleAnalyitcsSource is using oAuth 2.0 for authentication with Google Analytics, which is a kind of standard at this moment.
Installation
Unfortunately, for the current version 1.6 Beta there is no automated installer.
How could this happen you might have ask — the answer is simple: there were problem with automated installer, which are being solved and I am sure that the final release won’t have any of the determined problems
 In the mean time you can easily download the DLLs, install & configure them:
You will need to register with you GACUtil.exe all those dlls, by invoking a Command Prompt as Administrator,
note that in my case all DLLs were extracted to “C:\Install\GoogleAnalytics\” folder:
gacutil.exe -i InstallShield c:\install\GoogleAnalytics\DotNetOpenAuth.dll
gacutil.exe -i InstallShield c:\install\GoogleAnalytics\Google.Apis.Analytics.v3.dll
gacutil.exe -i InstallShield c:\install\GoogleAnalytics\Google.Apis.Authentication.OAuth2.dll
gacutil.exe -i InstallShield c:\install\GoogleAnalytics\Google.Apis.dll
gacutil.exe -i InstallShield c:\install\GoogleAnalytics\Newtonsoft.Json.dll
gacutil.exe -i InstallShield c:\install\GoogleAnalytics\SSISComponents.Dts.Pipeline.GoogleAnalyticsSource.dll
gacutil.exe -i InstallShield c:\install\GoogleAnalytics\Zlib.Portable.dll
As a next step, simply copy all of those files into “C:\Program Files (x86)\Microsoft SQL Server\110\DTS\PipelineComponents\” folder of you installation. (In my case I am using SQL Server 2012, if you are using a different version, you will need to adjust the path accordingly to the version number).
You are all set!
Usage
 Google Analytics for SSIS Source is really easy to use: after creating a new .dtsx file, let us go and add a new DataFlow component as shown on the picture on the left (I named it “Read GoogleAnalytics”).
 Inside our DataFlow, add a new Source Element – GoogleAnalyticsSource, as shown on the picture. It has a distinctive green icon which will help you to recognise it.
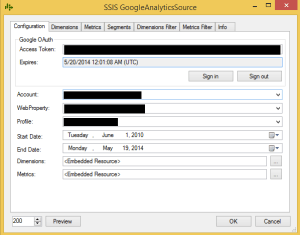
 After double click on our Source, you will be presented with the following screen of options as it can be seen on the left.
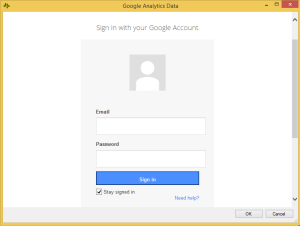
First thing to do is to authorise the component for reading data out of the Google Analytics engine – click on the “Sign in” button to be presented a login window for Google Account, such as shown on the screen below:
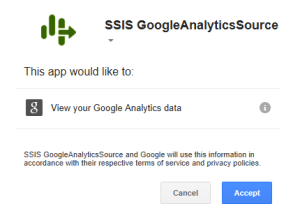
After successful login, you will need to authorise the data sharing for the plugin by clicking on the “Accept” button:
You will return back to the previous configuration screen where the “Google oAuth” group shall have all data already filled out for you:
As you can see on my basic configuration screen, the Access Token is already filled out, so the only things I have to select/change are Account, WebProperty and Profile.
Account is your Google Account that you are logged in, If you are logged into multiple accounts at the same time, you will be able to select the one you will be using for the Google Analytics data extraction.
WebProperty is basically the site you are extracting data from, and
Profile is the configured profile at the Google Analytics.
There is a good amount of options available at the current version, which I might describe one day in a later post, but for the beginning we need to select 2 things: Dimensions & Metrics.
 For this exercise I will simply select the Date as my primary Dimension. My results will be delivered in a “YYYYMMDD” format which I can easily transform in SSIS into any format I need at my destination.
We are not limited just by 1 Dimension and we can select multiple, but things will progressively become more complicated from here. One absolutely awesome detail about this screen is that every single Dimension has a description text at the bottom of the Dialog (with yellow background) and so it is enough to click on the Dimension without selecting it in order to obtain the detailed information of what type of information you will be served with.
 From the Metrics perspective I will simply select the number of Page Views as shown on the screen.
This will allow me to get the detailed information on the amount of Page Views that my website was getting per day. As in the case of Dimensions I am not limited at just 1 Metric, I can actually go and select multiple, and oh my – there are so many of them that are listed at your disposure.
 Before advancing any further, you have an option of selecting preview of the data you will be getting – and for that you just need to click on the “Preview” button at the bottom of the Dialog screen. If you need you can select a different sample from the default (200 rows).
You will be served 1 more Dialog screen where you will be able to see the first 200 (or any other value you choose) rows, that you can scroll and browse, making sure that this is exactly what you expect.
Note: Take a good look at the headers, you will see that they are named according to the ga:dimension or ga:
After verifying all the data, click on the “Close” button and then on the “Ok” at the main Dialog screen to return back to the DataFlow editing.
 At the end, I simply added a OleDBDestination to my DataFlow, connected and mapped it to the provided and executed the package.
Enjoy SSIS GoogleAnalyticsSource !


