Thanks to the December 2015 update released for Power BI, we can now use R to visualize our data in Power BI! Make no mistake, this is huge news and in this blog post I want to walk you through how to use the new R Script Visualization in Power BI and get you started with using R to create your first visualizations.
Read These Top 5 Power BI Tips
Not only can we create and download custom visuals from PowerBI.com to extend the capabilities of Power BI, we can use R to create a ridiculous amount of powerful visualizations. If you can get the data into Power BI, you can use R to perform interesting statistical analysis and create some pretty cool, interactive visuals.
Getting Started
If you’re new to R, like myself, R is a programming language for statistical data analysis. The R programming language is widely used by statisticians and data scientists and has been around since the early ’90s. R is used to perform advanced types of analysis and create graphic visuals. So what does this mean for Power BI? We can do some pretty awesome things regarding data analysis and visualization!
Disclaimer: I don’t pretend to be a statistician, data scientist, or R expert. I’m just a regular dude who loves data and likes helping my customers gain deeper insights into their data. With this in mind, I’m just sharing with you, the reader, what little bit I know in order to help others learn. Enjoy!
Before we can jump into R, there’s a few things we need to do first to get Power BI set up for this. 
First, go download the latest version of Power BI Desktop.
Now, go download Revolution R Open. Follow the instructions and install RRO.
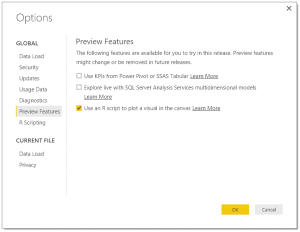
After you’ve done that, start up Power BI Desktop. We need to enable the R script preview feature. Go to File > Option and settings > Options.
Go to the Preview Feature tab and click the checkbox to Use an R script to plot a visual in the canvas.
Then go to the R Scripting tab. Provide the location where RRO was installed. I just used the default location, as you can see below.
You should then receive a message asking you to restart Power BI Desktop. Close Power BI Desktop and open the tool again.
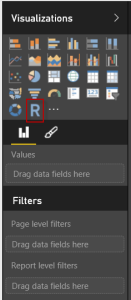
Once you’ve restarted Power BI Desktop, the R Script Visualization visual should then appear in your Visualization toolbox.
Now you’re ready to start using R to be all data scientist-y!
Important note: The R Script Visualization feature in Power BI is currently a preview feature. This means that the way it works could change a little bit or a whole lot at some point in the future. This also means that the R Script Visual is not currently able to be refreshed in the Power BI online service. Personally, I would expect this to change soon but can neither confirm nor deny any of this.
Creating R Script Visuals with Power BI
Now we just need to get some data into Power BI! To me, this is simply amazing. Power BI can connect to almost any data source, massage and transform the data, and thus preparing your data for data analysis with R. Mind blowing!
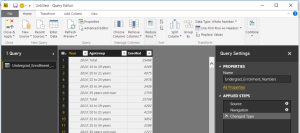
The data I’m using for these example is some enrollment Census data I’ve downloaded from census.gov. You can find the same data here, if you’re so inclined.
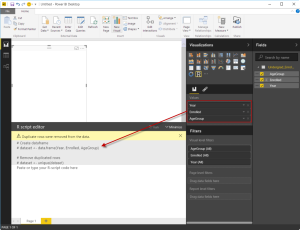
After you’ve imported your data sources and created the model, add the R Script Visualization to your report. Then drag the fields from the model into the Values area of the R Script Visualization.
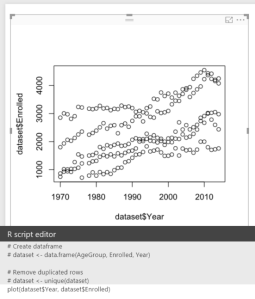
As you add fields to the R Script Visualization, you’ll notice some code automatically appear in the R script editor window.
This code creates a dataframe object called “dataset” and then removes the duplicate rows from the dataframe object. This code is created by default and to my knowledge cannot be modified. This could change in the future. A dataframe is similar to a table and contains columns that contain data. With the dataframe, “dataset”, created, we can then begin to create some very simple R visualizations.
To create a very simple scatter plot, use the plot command. The first argument is the values to display on the x axis and the second argument is the values to display on the y axis. In the example below, my year is displayed on the x axis and the enrollment numbers are displayed along the y axis:
plot(dataset$Year, dataset$Enrolled)
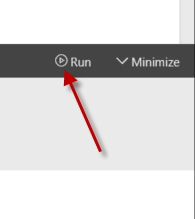
After you’ve entered in the R code, click the Run button to execute the R script and display the visual.
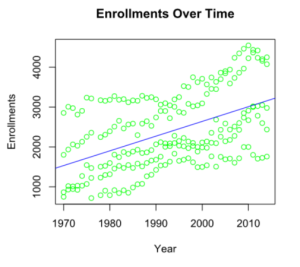
We can add a few enhancements to the scatter plot, like custom labels for each axes and a chart title using the following code:
plot(dataset$Year, dataset$Enrolled, col="Green", xlab="Year", ylab="Enrollments", main="Enrollments Over Time")
The col argument allows us to change the color of the data point, xlab and ylab allow us to customize the axes labels, and main allows us to specify the chart title.
So that’s pretty simple, But we can also do some more advance stuff, like add a best fit line, boxplots, coplots, histograms, and more.
Here’s adding a blue best fit line to the scatter chart:
plot(dataset$Year, dataset$Enrolled, col="Green", xlab="Year", ylab="Enrollments", main="Enrollments Over Time")
bfl <- lm(dataset$Enrolled ~ dataset$Year)
abline(bfl, col="blue")
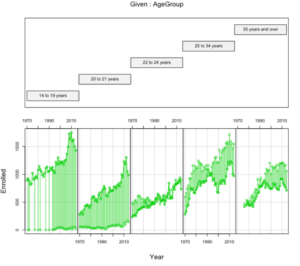
In my enrollment dataset I have enrollment numbers for different age groups and types of students (under grad, 2 year, graduate). Wouldn’t it be cool if we could see one scatter plot for each age group and then filter by type? Well, I’m in luck! I can use coplot to create a scatter plot for each AgeGroup category:
attach(dataset)       ### use attach(dataset) to attach "dataset" so I don't have to type dataset$ everytime I want to reference a field ###

coplot(Enrolled~Year|AgeGroup, col=3, main="Enrollment by Age Group",type="o", rows=1) ### "type = o" changes the plot to be circles over a line, "rows = 1" forces all charts on 1 row ###
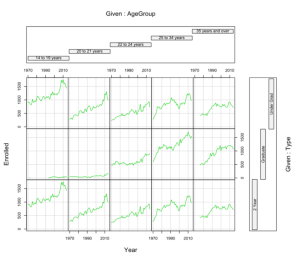
So that’s pretty cool. But we can take this one step forward and create a matrix layout for our line graphs using coplot. I want to see one plot for each AgeGroup and each Type:
attach(dataset)       ### use attach(dataset) to attach "dataset" so I don't have to type dataset$ everytime I want to reference a field ###

coplot(Enrolled~Year | AgeGroup * Type, col=3, main="Enrollment by Age Group",type="l")
### "type = l" changes the plot to be circles over a line ###
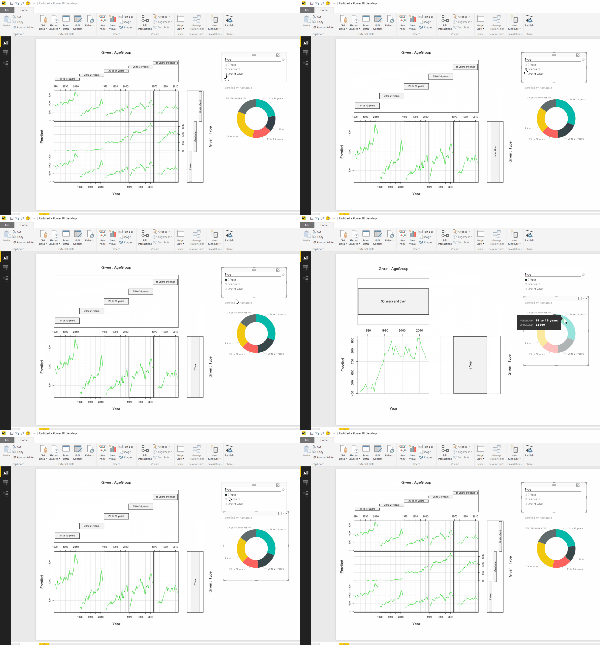
How awesome is that? Now here’s the real kicker: I can slice and filter these visual through the usual methods! I can use another chart or a slicer to filter! Don’t believe me?
If that’s not flipping awesome then I don’t know what is. Each time I click the slicer or donut chart, the R script is rerun with the filter criteria thus generating a new visualization of the data. Just keep in mind depending on the R script you’ve written, the amount of data, and other factors, this could be slow.
In all honesty, this cross filtering action doesn’t appear to be working on PowerBI.com yet, but will most likely be soon. I can’t speak for the Power BI engineering team, but I’d imagine they’re working on it.
Check out this boxplot chart:
attach(dataset)
boxplot(Enrolled~Type,   type="l", horizontal=TRUE, col=(c("Blue","Gold","Red")), notch=TRUE, xlab="Enrolled", ylab="Student Type")
And a histogram chart:
attach(dataset)
hist(Enrolled, col="purple")
So that’s pretty much the basics. I haven’t even touched installing custom packages for other visualization types but that’s definitely a blog post for another day.
I hope you found this help! I’m very excited about this new functionality and can’t wait to see some of the awesome visuals people will put together!
Helpful Links
Very helpful site with some good info on creating basic visuals with R: http://www.statmethods.net/
Creating R Visuals with Power BI: https://powerbi.microsoft.com/en-us/documentation/powerbi-desktop-r-visuals/
Jan Mulkens has a helpful blog post that may help you if you run into an issue with decimal settings in your OS: http://blog.janmulkens.be/power-bi-and-r-part-2-remarks-and-errors/
Feedback?
I’d love to hear what you think! Leave a comment or question down below to share your experiences with your fellow data nerds.


