If you hate things that are slow, I bet you certainly want to know the reason for the slowness. So, if you are SQL Developer and your query run slow, you would prefer to have query execution statistics so that you can figure out what causing the query to run slow. To get the query execution statistics, you can use two useful “SET STATISTICS” commands;
- SET STATISTICS IO ON – It provides the statistics details of I/O
- SET STATISTICS TIME ON – It provides the statistics details of CPU
DEMO
To demonstrate it, I am going to run below SELECT statement using AdventureworksDW2016CTP3 database tables [Sales].[SalesPersonQuotaHistory] and [Sales].[SalesPerson].
SET STATISTICS IO ON;
SET STATISTICS TIME ON;

USE [AdventureworksDW2016CTP3]
GO

SELECT SPH.[BusinessEntityID],SPH.[SalesQuota], SP.SalesYTD
FROM [AdventureworksDW2016CTP3].[Sales].[SalesPersonQuotaHistory] SPH
INNER JOIN [AdventureworksDW2016CTP3].[Sales].[SalesPerson] SP
ON SPH.BusinessEntityID = SP.BusinessEntityID
where SPH.[rowguid] = '0A69F453-9689-4CCF-A08C-C644670F5668'
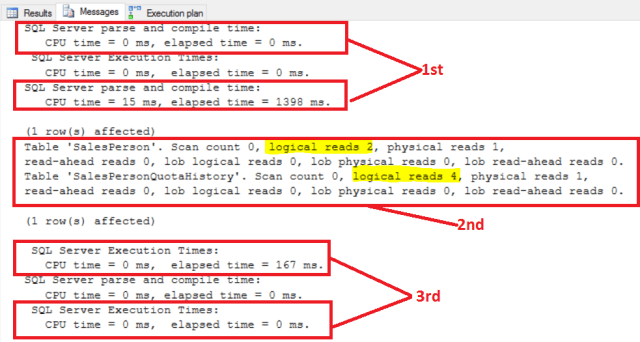
Below the statistics details of the SELECT statement.
Breakdown of ‘SET STATISTICS’ commands;
1st Part:
If you look at the first setup of the item, it tells how long SQL Server took to parse the command and create & compiles an execution plan for the SELECT statement.
2nd Part:
It tells I/O information for the database object that SQL Server has to read in order process the query. If you see the above 2nd option in the above snapshot, there are two tables where the data is coming from. The important item in the above image is the logical read.
A logical read is when SQL Server has read a page from either from memory or disk to process this statement. It helps to indicate how much data really needs to be processed in order to execute the statement. In the above snapshot, If you look at the SalesPersonQuotaHistory table, there are 4 logical reads had to occur. Each logical read is a page in SQL Server, and each page is 8KB in size. So 4 logical reads multiply by 8KB (4*8KB), we can see that SQL Server is reading very less data.
3rd Part:
The third section gives the amount of CPU SQL Server took to execute the statement and how long that process took. Sometime you will see CPU time is larger than the elapsed time. it is mainly because of your queries has done parallel execution for at least part of your statement.
Conclusion
The “SET STATISTICS” commands do give us a useful statistics of the amount of resources up on the database server that are being used by a query. If I find a significant number of logical reads by a statement, I always explore the opportunity to tune that portion of the statement.
The post Getting Query Execution Statistics appeared first on .


