Have you ever wondered where a certain field is used in a report? Or maybe you need an easy way to find broken field references in a report? Certain 3rd-party tools such as Measure Killer and Power BI Helper (not updated recently) have helped us with this task in the past. But now we can perform this task with a notebook in Fabric!
This is made possible by the Semantic Link Labs Python library. Please note that PBIR format is still in preview at the time of publishing this blog post, so use it at your own risk. Also, this works only on reports published to the Power BI service. Since this notebook is not making any changes to the report, I feel it’s pretty safe to run, but do remember that it uses CUs on your Fabric capacity while you run it.
Using Semantic Link Labs
To use the Semantic Link Labs package in your notebook, you need to install it and import the subpackages you need. You can also create an environment with Semantic Link Labs installed, and then you can skip the install step.
If you need to install and import, you would just write some Python like this:
%pip install semantic-link-labs

import sempy_labs as labs
from sempy_labs import report as rep
from sempy_labs.report import ReportWrapper
The important functions used in my field usage notebook are:
The list_semantic_model_objects function shows a list of all semantic model objects (measures, columns, hierarchies) that are used in a report and where the objects were used (i.e. visual, report filter, page filter, visual filter). It has a parameter that allows you to add an extra column that identifies whether the semantic model object used in the report exists in the semantic model which feeds data to the report.
The list_visuals function shows a list of visuals in a specified report.
I call these two functions and merge the results to give you a nice field usage list.
Using My Notebook
I created a notebook (download from Github here) that combines the Semantic Link Labs functions with some basic Python to allow you to do the following:
- See a list of all fields and where they are used in a report
- Search for a specific field to see where it is used in a report
- Search for fields from a specific table to see where they are used in a report
- Search for broken field references (i.e., the measure in the semantic model was renamed and the report was not updated)
You’ll find documentation and instructions at the top of my notebook to help you use it. First, read the documentation.
Then skip or run the install step as needed. Run the import step to get all the required libraries for the notebook to work.
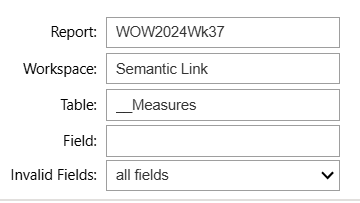
The third code cell in my notebook creates some widgets to accept input for which report and fields you would like to search. You must enter at least the report name and workspace name. You may optionally specify a table name alone, or a table name and field name. By default, the notebook will look for all fields, whether they are valid or invalid (broken field reference). Change the selection if you would like to see only valid or only invalid.
The last cell of the notebook returns a table with the following columns:
- Table Name – the table in which the field is located
- Object Name – the field name
- Object Type – indicates whether the field is a measure or column
- Report Source – The part of the report in which the field is used (visual, report filter, etc.)
- Report Source Object – The name of the object in which the field is used (usually the report name, page name, or visual name)
- Valid Semantic Model Object – true/false as to if the field reference is valid
- Page Name – unique ID of the page within the report where the field is used
- Page Display Name – the page name you see in Power BI where the field is used
- Visual Name – if the field is used in a visual, the unique ID of the visual where the field is used
- Display Type – if the field is used in a visual, the type of visual where the field is used; e.g., Bar chart, Slicer, HTML Content (lite)
- Visual Loc X – if the field is used in a visual, the x-coordinate of the visual
- Visual Loc Y – if the field is used in a visual, the y-coordinate of the visual
- Visual Loc Z – if the field is used in a visual, the z-order of the visual
If I have a report named WOW2024Wk37 and I want to see where all the fields in the __Measures table are used, I can enter that information and run the final cell.

My results will help me see things like my [Color – CY] measure is used on the Sales Report page in a card, a bar chart, and a custom column chart. If I need to find the visual in the report, I can look at the x and y coordinates to give me an idea of where to look.

Exploring Semantic Link Labs
I’m just getting into Semantic Link Labs, and I’m really enjoying the report package. I’m sure you’ll see more from me about this library as it is a great wrapper for easy access to Power BI APIs and a good way to automate the tasks of getting metadata and making updates in Power BI reports. If you are using Semantic Link Labs, I’d love to know what you are doing with it.

