In this post we’ll look at how quick and easy it is to use the XEvent Profiler to create an Extended Events (XE) session to replace the most common usage of SQL Server Profiler.
Before you start, update your SSMS to a recent version (17.3) or later:
Now, let me ask you the question – how often do you just go into Profiler and create a trace taking all the defaults? If you’re like me then that’s pretty often. It’s nice and easy, select the menu item from SSMS and you’re going in a couple of clicks.
All XEvent Profiler does is implement a couple of standard XE sessions very similar to Profiler, that you can launch with a click or two.
You can find XE Profiler in the object explorer in SSMS under each of your SQL instances – just below SQL Server Agent:
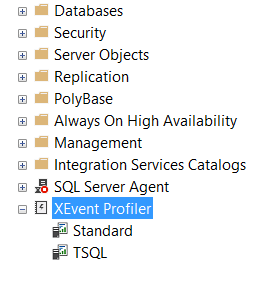
Because it’s there for each instance, you don’t have to then connect to the instance separately (as you do in Profiler).
You’ve got two options, Standard which pretty much equates to the default trace in Profiler, or TSQL which will just capture SQL statements being executed. Let’s right-click on Standard and select “Launch Session”. Here’s the Live Data view that comes up:
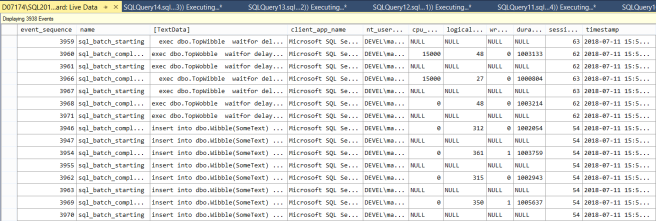
You can see that looks pretty similar to what you see for your traditional traces.
Now, one thing I almost always do for this sort of trace in Profiler is capture the database name. This is a bit of a pain, because I have to select “View all columns”, scroll along to find the database name column, then select it for each relevant event I’m capturing.
In XE it’s much easier. I just right click on one of the column headers in the above view and select “Choose Columns”:
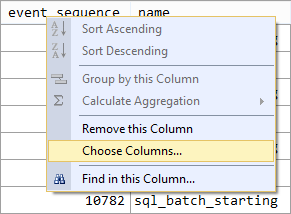
Which brings up the menu of columns available to me:
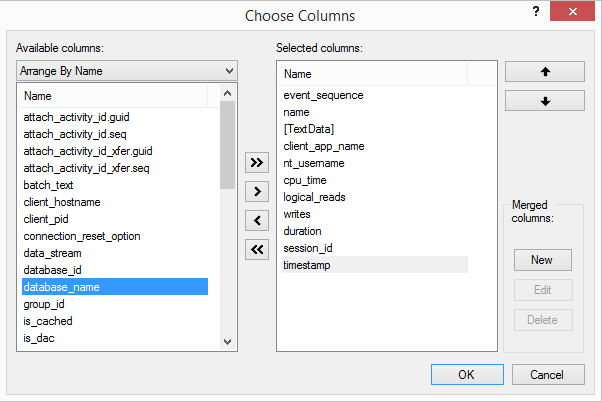
I can then just select the database_name column in the left and use the arrow button to push it into the list of selected columns. Want row_count? That’s there too, along with a whole bunch of other stuff. I’ll add those and remove a few I don’t want and exit the dialog.
The other thing I’m commonly going to want to do is add a filter to one or more of the columns. When you’re viewing live data you get the Extended Events toolbar shown in SSMS below the menu bar, just click on Filters…

And you get the filters dialog:
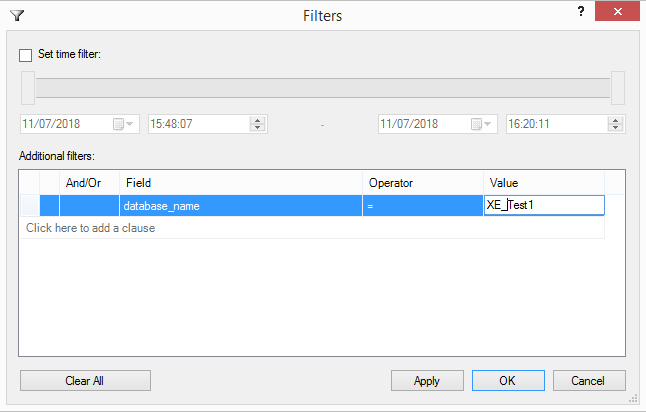
Click below “Field” to select a column and then add a value to filter on. In this case I’m going to filter to look at a specific database.
It’s worth noting that there are a bunch of operators you can use (not just equals), you can do greater than, less than, contains, does not contain, is null etc.
Now we can see the effect of those changes in the Live Data view:

The above is what I’d usually do in Profiler, except that here I’ve also added an extra column and removed a few – because it was so easy to do. The whole thing felt like a simpler and cleaner experience than the old way.
But I get it, a marginally simpler experience probably isn’t enough to make you change habits. What might, is what you can do with your trace results once you’ve got them. In the next post we’ll look at sorting, grouping and aggregation.
Previous posts in this series:
There’s Still a Place for SQL Server Profiler
Using the built-in System Health session
Exporting Extended Events Session Data to a Table


