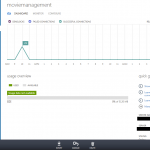
If you’ve been working with the Azure SQL Database portal, you know that you have a query window. Within the query window you can run queries against your server. You’ll get back results, timing, everything you need to observe behavior within the system. What’s that? You never heard of this? Let’s figure it out real quick. Here’s my portal to my Azure SQL Databases:
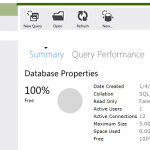
 Yes, all sorts of things you can do from here, but we’re focused on the bottom of the screen at the Manage button. Clicking this button will open up the Management portal window, part of which you can see below:
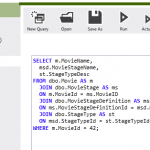
Pretty prominent in the upper left corner, you can see the New Query button. I’m sure you’ll be shocked to find that clicking on that gives you another window in the portal as shown below. Worth noting though is the listing under My Work on the left side of the screen. These are more or less windows that you can switch between, without losing your work. It’s almost like tabs in SSMS. You can open multiple queries as you see. I have two unnamed queries I’m playing with and a file, TraceCaptureDef.1.sql, which will generate all sorts of fun errors if I try to run it on Azure. But the main point is, don’t feel like you have to open multiple tabs in your browser, you have a lot of control right there in the Management Portal.
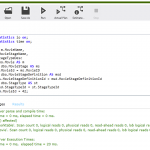
I have a query there ready to go. A few more points about that query. Note that you do have some color coding, showing key words highlighted in blue. I typed this query and formatted in Management Studio before pasting it into the query window here, but that formatting went away to a degree. Something to keep in mind. Also note, that you don’t have properties about this query that you can set. If you want to see statitistc io or time, which you can, you’ll have to set them manually using T-SQL code. But once set, you can get messages showing how long the query ran and what sort of resources were used as you see here:
You can also choose to look at an Estimated execution plan by clicking the appropriate button, or toggle the inclusion of an Actual Execution plan by again, clicking the button at the top of the window. Here’s what you get for an Actual plan within Azure SQL Database:
I’ve posted in the past about some of the details that you can access when looking at execution plans within Azure SQL Databases. I’ll be posting some more on the Management Portal, execution plans, and query tuning in Azure. Worth mentioning, if you look at my posts from several month ago, how they’re displaying icons in the plans has already changed. This is a seriously moving target.
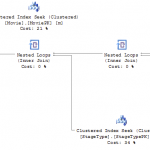
Before I go, compare that execution plan with the same one from SSMS:
A couple of things to point out. Obviously, it’s different. But the real point here is that these are identical, empty, databases. The structures are 100% the same. The queries are 100% the same. But the Azure SQL Database plan includes a scan where there’s a seek in SSMS. More fun little indications that the optimizer that exists in Azure is not the same as in the base product (and yes, I’ve got the latest SP and CU installed). Something to keep in mind when you start writing queries against your Azure SQL Database instance.


