Actually I’m not sure if anyone still believes this anymore. If you read the BOL description carefully it states that truncate de-allocates the pages rather than deleting the rows – meaning only the de-allocations are logged – resulting in far fewer log records. Incidentally this is also why the truncate operation can be rolled back – the pages haven’t been deleted, so can be re-allocated.
That said I had just discovered some cool queries in Itzik Ben-Gan’s book designed to analyse transaction log internals and wanted to try some experiments.
This query uses the undocumented fn_dblog() function. This function uses the current database context and accepts a start and end LSN as arguments, if these are passed as null then all active log records are returned.
The idea behind the query is to query the transaction log and store the number of log records, the size of the log records and the current time. Then execute some operation and query the transaction log again – comparing the results to the saved results to get the deltas for the operation. Results are aggregated for easier analysis and followed by a breakdown of the log operations.
Here’s the basic framework:
--declare variables for initial results
DECLARE @numrecords AS INT, @size AS BIGINT, @dt AS DATETIME;

--query and save initial results
SELECT
  @numrecords = COUNT(*),
  @size       = COALESCE(SUM([Log Record Length]), 0),
  @dt         = CURRENT_TIMESTAMP
FROM fn_dblog(NULL, NULL) AS L
WHERE AllocUnitName = '<table name>'
OR AllocUnitName LIKE '<table name>.%';

--perform some operation

--query the log again and compare with initial results
SELECT
  COUNT(*) - @numrecords AS numrecords,
  CAST((COALESCE(SUM([Log Record Length]), 0) - @size)
    / 1024. / 1024. AS NUMERIC(12, 2)) AS size_mb,
  CAST(DATEDIFF(millisecond, @dt, CURRENT_TIMESTAMP)/1000.
   AS DECIMAL(12,3))
    AS duration_sec
FROM fn_dblog(NULL, NULL) AS L
WHERE AllocUnitName = '<table name>'
OR AllocUnitName LIKE '<table name>.%';

-- Breakdown of Log Record Types
SELECT Operation, Context,
  AVG([Log Record Length]) AS AvgLen, COUNT(*) AS Cnt
FROM fn_dblog(null, null) AS L
WHERE AllocUnitName = '<table name>'
OR AllocUnitName LIKE '<table name>.%'
GROUP BY Operation, Context
ORDER BY Operation, Context;
So let’s put it to the test. For this demo I’m going to use the AdventureWorks2008 database – but any database will do really. I’m looking at the Sales.SalesOrderDetail table which has 121317 rows.
Backup the database first.
use master
go

Backup database AdventureWorks2008
to disk = N'<your backup directory>\AdventureWorks2008.bak'
Now run the query and delete every row from the table:
USE AdventureWorks2008
GO

DECLARE @numrecords AS INT, @size AS BIGINT, @dt AS DATETIME;

SELECT
  @numrecords = COUNT(*),
  @size       = COALESCE(SUM([Log Record Length]), 0),
  @dt         = CURRENT_TIMESTAMP
FROM fn_dblog(NULL, NULL) AS D
WHERE AllocUnitName = 'Sales.SalesOrderDetail'
OR AllocUnitName LIKE 'Sales.SalesOrderDetail.%';

DELETE [Sales].[SalesOrderDetail];

SELECT
  COUNT(*) - @numrecords AS numrecords,
  CAST((COALESCE(SUM([Log Record Length]), 0) - @size)
    / 1024. / 1024. AS NUMERIC(12, 2)) AS size_mb,
  CAST(DATEDIFF(millisecond, @dt, CURRENT_TIMESTAMP)/1000.
   AS DECIMAL(12,3))
    AS duration_sec
FROM fn_dblog(NULL, NULL) AS L
WHERE AllocUnitName = 'Sales.SalesOrderDetail'
OR AllocUnitName LIKE 'Sales.SalesOrderDetail.%';

-- Breakdown of Log Record Types
SELECT Operation, Context,
  AVG([Log Record Length]) AS AvgLen, COUNT(*) AS Cnt
FROM fn_dblog(null, null) AS L
WHERE AllocUnitName = 'Sales.SalesOrderDetail'
OR AllocUnitName LIKE 'Sales.SalesOrderDetail.%'
GROUP BY Operation, Context
ORDER BY Operation, Context;
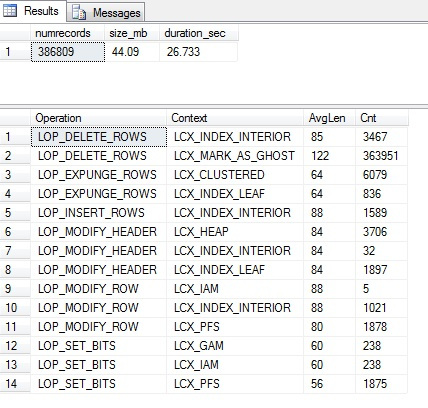
With these results on my machine
386809 log records were created using 44MB of space and taking nearly 27 seconds.
Restore the backup and run the same query but this time with a truncate.
use master
go

restore database AdventureWorks2008
from disk = N'C:\MSSQL\SQLDataDumps\AdventureWorks2008.bak'
with replace
go

USE AdventureWorks2008
GO

DECLARE @numrecords AS INT, @size AS BIGINT, @dt AS DATETIME;

SELECT
  @numrecords = COUNT(*),
  @size       = COALESCE(SUM([Log Record Length]), 0),
  @dt         = CURRENT_TIMESTAMP
FROM fn_dblog(NULL, NULL) AS D
WHERE AllocUnitName = 'Sales.SalesOrderDetail'
OR AllocUnitName LIKE 'Sales.SalesOrderDetail.%';

TRUNCATE TABLE [Sales].[SalesOrderDetail];

SELECT
  COUNT(*) - @numrecords AS numrecords,
  CAST((COALESCE(SUM([Log Record Length]), 0) - @size)
    / 1024. / 1024. AS NUMERIC(12, 2)) AS size_mb,
  CAST(DATEDIFF(millisecond, @dt, CURRENT_TIMESTAMP)/1000.
AS DECIMAL(12,3))
    AS duration_sec
FROM fn_dblog(NULL, NULL) AS L
WHERE AllocUnitName = 'Sales.SalesOrderDetail'
OR AllocUnitName LIKE 'Sales.SalesOrderDetail.%';

-- Breakdown of Log Record Types
SELECT Operation, Context,
  AVG([Log Record Length]) AS AvgLen, COUNT(*) AS Cnt
FROM fn_dblog(null, null) AS L
WHERE AllocUnitName = 'Sales.SalesOrderDetail'
OR AllocUnitName LIKE 'Sales.SalesOrderDetail.%'
GROUP BY Operation, Context
ORDER BY Operation, Context;
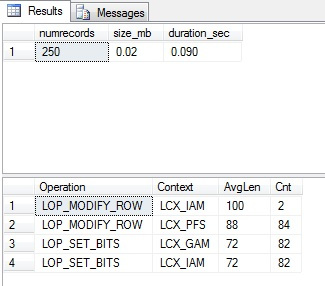
This time with these results:
Conclusion: The truncate is logged – as we can see it is all activity against PFS, IAM and GAM pages as we would expect for page de-allocations. It is also much faster and smaller than the delete with only 250 records on .02MB of space in less than a tenth of a second.


