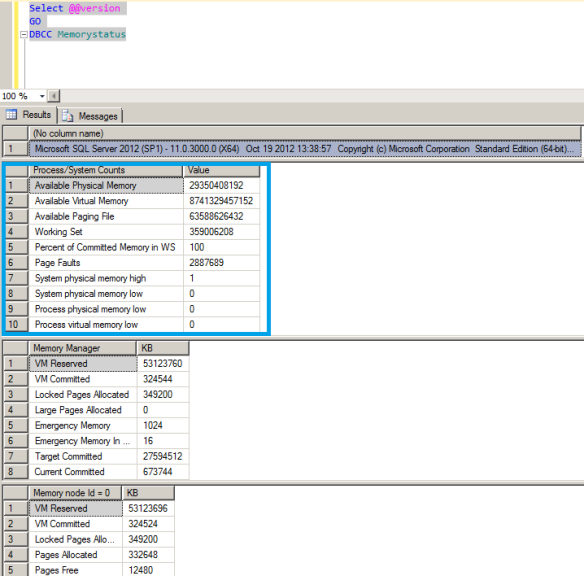
This post is not a detailed explanation of DBCC Memorystatus for SQL2012,but a quick observation I made recently for the node Process/System counters.
This is one area to look at under DBCC Memorystatus output to get a quick snap shot of the current state of memory and understand if there is a memory pressure.
In SQL 2012 you are provided with this information,ie info from the Process/System counters right away you run DBCC Memorystatus. This is the first set of data which is retrieved by the DBCC command.
I really liked the idea of getting information like system physical memory high/low, Process physical/virtual memory low etc right away I run DBCC as this info is one which I look at all the time during initial analysis phase.
In SQL 2008 R2,you still have this data but you will need to scroll all the way down to get this info. Still good, atleast we have this info for a quick ref.
In SQL2005,you don’t have this info at all.Yes,things are not so easy during the early days !
Conclusion
The process and system counters section is very useful and keep watching this space for more.
Thanks for reading.


