Background
DAX offers many powerful time intelligence functions that can be applied at virtually any level of a date / time hierarchy. There are also custom patterns available that can be implemented for week based and ISO 8601 calendars that will emulate the same functionality (case in point, see Time Patterns articles on DaxPatterns.com as well as other articles on SQLBI.com).
An issue that arises with the implementation of time intelligence in DAX, however, is that the default behavior is to create a new metadata entry for every measure created in the model. This behavior can quickly propagate your cube metadata into something confusing and error prone to users.
Overview
As an example, consider a common requirement: YTD, QTD, and MTD measures. Assuming a standard Gregorian calendar, these measures could be implemented in the AdventureWorks 2012 Tabular Model as follows:
Note: QTD and MTD would use the same calculation with the exception of replacing TOTALYTD in the DAX formulas with TOTALQTD and TOTALMTD, respectively.
YTD Internet Sales Amount :=
IF (
MIN ( ‘Date'[DateKey] )
<= CALCULATE (
MAX ( ‘Internet Sales'[OrderDateKey] ),
ALL ( ‘Internet Sales’ )
),
TOTALYTD ( [Total Internet Sales Amount], ‘Date'[Date] )
)
Extending the requirement to include comparisons against previous year, we could implement these measures as well:
PY YTD Internet Sales Amount :=
IF (
MIN ( ‘Date'[DateKey] )
<= CALCULATE (
MAX ( ‘Internet Sales'[OrderDateKey] ),
ALL ( ‘Internet Sales’ )
),
TOTALYTD (
[Total Internet Sales Amount],
SAMEPERIODLASTYEAR ( ‘Date'[Date] )
)
)
If we save and browse our model with these definitions in place, we end up with this result:
Notice how MTD amounts incorrectly render at the quarter and year levels of the date hierarchy. Likewise for QTD at the year level as well. These issues are also repeated for the PY measures.
The “quick and dirty” solution to this problem would be to hide any values for *TD measures where an inappropriate date attribute is used in the pivot / report. This would eliminate the risk for errors in reports (or, more likely, the risk of the developer losing all credibility). However, there still remains a major unresolved issue with this approach: Every corresponding measure for which there is a *TD requirement would have metadata in triplicate. Users would have to remember to select MTD, QTD, or YTD versions of each measure from the model depending on which time intelligence function was desired for reporting. Likewise, a report with drilldown on the date hierarchy would basically end up being dumped to a spreadmart, or become a developer created / assisted task as the ad hoc layout of such a report from the cube would be 3x larger then necessary.
Solution
Enter the Switch() function. Adding a check against the date hierarchy context being filtered in the query, this function can consolidate and render the appropriate *TD measure while exposing only a single metadata entry in the model. We can now meet a common requirement to see cumulative amounts as such:
Note: PY Internet Sales Amount To Date measure would reference PY versions of the same measures
Internet Sales Amount To Date :=
SWITCH (
TRUE (),
ISFILTERED ( ‘Date'[Day Of Month] ), [MTD Internet Sales Amount],
ISFILTERED ( ‘Date'[Month Name] ), [QTD Internet Sales Amount],
ISFILTERED ( ‘Date'[Calendar Quarter] ), [YTD Internet Sales Amount],
ISFILTERED ( ‘Date'[Calendar Year] ), [YTD Internet Sales Amount]
)
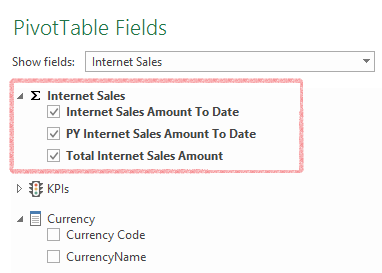
The intermediate *TD measures can now just be hidden from client tools in the model, and used only as intermediate calculations by the measures implementing the Switch() function. This allows us to consolidate metadata and business rules into a single measure per time series like so:
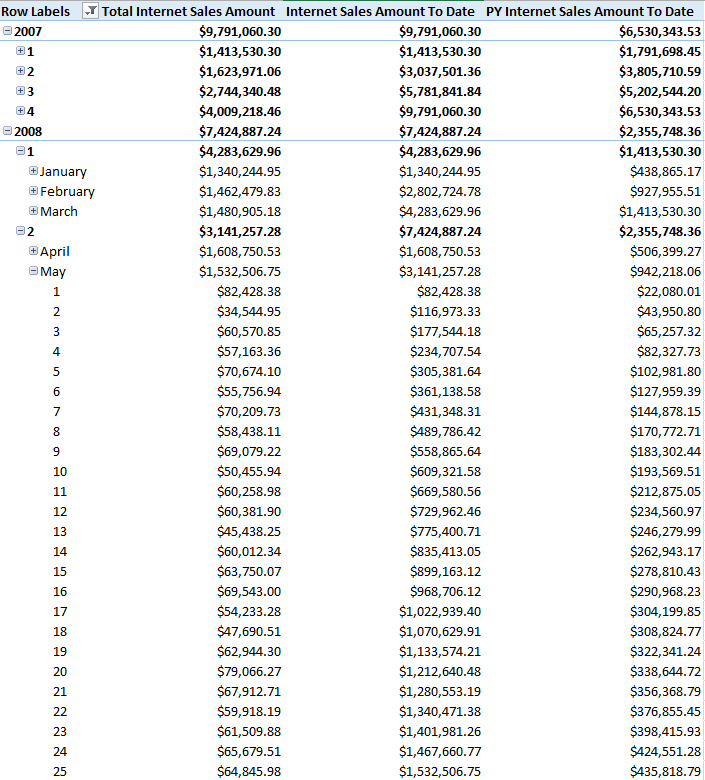
Here’s how the data looks based on the Switch() rules used above (dates are filtered through to 5/25/2008 to show *TD functionality against PY):
The Internet Sales Amount To Date and corresponding PY measures now show only the required cumulative totals at the appropriate level of the date hierarchy. Here it is MTD at day level, QTD at month, and YTD elsewhere. This can be easily changed to meet different requirements purely in the Switch() function.
Parting Thoughts
The nice part about this implementation is that it is naturally extensible thanks to DAX’s built in inheritance. Creating a single YOY cumulative calculation is simply:
YOY Internet Sales Amount To Date := [Internet Sales Amount To Date]- [PY Internet Sales Amount To Date]
…and so on, etc..
The DAX implementation of time series metadata is still not as nicely abstracted as Multidimensional yet, but there are alot of tools you can use to simplify tabular models to meet most user requirements. Hope this helps!


