I’m continuing to evaluate Confio’s Ignite database monitoring tool. I’ve had it collecting data on a couple of production servers for about a week now. Based on what I’ve seen so far, it’s looking like a pretty good piece of software.
Breaking with the usual tradition, I’m going to talk about the things I’m not crazy about with the software, before I start singing its praises. The first thing, that I thought was missing, but is actually just hard to find, is the ability to look at the query information that Ignite collects, broken down by database. It looks like you should be able to get to it by looking at the Databases tab, but instead you have to first drill down into a time-period, then select specific databases within that time period, which will show you the queries by database. I know that in my environment, it’s this database listing of queries that is probably going to get used a lot. Tracking it down required help from the Confio team, which they quickly provided. They also showed me a way I could run queries to get this from their database so that I could create a report.
Speaking of reports, because they support Oracle & DB2 as well as SQL Server through their interface, no Reporting Services. OK, I recognize that I’m more than a bit Microsoft-centric when I say this, but I’d like to see SSRS reports so that I can manipulate things the way I want to. Again, not the end of the world, but it’s just something I don’t like. Because the data store is available though, I can get in there and create my own reports to my heart’s content and, if I like their report, I can always run a trace to capture the query and see how they built it so that I can build one of my own that mirrors it. I think they provide a mechanism for customizing reports by building some XML that will add it to the interface, which is a bit of a pain, but shows they’re on top of things.
One other thing that bothered me as I worked with Ignite is that, in the real time monitoring section, it was hard to find my way to the list of locks. It had the list, but it just wasn’t obvious how to get to them and this is something I’m used to looking at when I’m worrying about real time performance issues.
Right, enough talking about things I don’t like. See this? I love this:
That’s a break down, by database, by day, of the cumulative waits on the system. Yeah, that little pink database is causing all sorts of problems on one of my production systems. I actually already knew this was a problematic database, but I wasn’t that precisely aware of when and how it had issues. You can drill down to see the same thing for a given day:
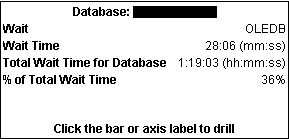
And it’s not just the pretty pictures either, showing that most of our production load is in the morning, but that there are some odd spikes at midnight, 4AM & 7PM, but there’s data available behind the graph. If you drill down and hover over the graphs, pop-ups like this one appear:
(Names have been blacked out to protect my job)
And it’s the focus on wait times and types provided by the trending views and reports that make this a very strong tool. Ignite also collects pretty standard performance metrics, buffer cache hit ratio, memory paging, etc. And you can customize which of those metrics it collects and which ones you display, all on your own. But almost any decent monitoring tool does that. I use a tool that does that, and might even do that a bit better. No, what seperates this tool from the pack is that ability to identify the wait states and the query that is causing them. That’s what will get you excited when you’re using Ignite.
It also has a little ping mechanism that shows response time on the server, a helpful and friendly little reminder that all performance isn’t around what’s happening on SQL Server, but what’s happening across the enterprise.
Big chunks of the interface are customizable and you can add or drop things using the little icons on the right side of the picture above.
I can keep going with all the stuff that’s good, because it’s a long list, but I’ll summarize what I like so far. I like the focus on wait states, a lot. I like the focus on query performance. Between those two I feel like I’m getting the majority of what I need from the tool, and more than I get from other, similar, monitoring tools. The fact that it does all the other standard data collection on top feels like gravy. The problems I have with the software so far are either personal issues, Reporting Services, or fairly minor problems. I have a monitoring product running against the same servers as Ignite and I haven’t seen any impact from Ignite’s monitoring showing up there, so it looks like this is a benign monitoring software.
For my final installment, I’m going to look up the skirt of Ignite and see what the underlying data structure looks like. The ability to gather and present data is all well and good, but more important is the ability to take that data and make serious use of it through reports or by building other data structures out of it for long term storage and reporting.


