In this post am going to introduce into some of the basic principles of probability – and use it in other posts going forward. Quite a number of people would have learned these things in high school math and then forgotten – I personally needed a refresher. These concepts are very useful if we can keep them fresh in mind while dealing with more advanced programming in R and data analysis.
Probability is an important statistical and mathematical concept to understand. In simple terms – probability refers to the chances of possible outcome of an event occurring within the domain of multiple outcomes. Probability is indicated by a whole number – with 0 meaning that the outcome has no chance of occurring and 1 meaning that the outcome is certain to happen. So it is mathematically represented as P(event) = (# of outcomes in event / total # of outcomes). In addition to understanding this simple thing, we will also look at a basic example of conditional probability and independent events.
Let us take an example to study this more in detail.
I am going to use the same dataset that I used for normal distribution – life expectancy from WHO. My dataset has 5 fields – Country, Year, Gender, Age. Am going to answer some basic questions on probability with this dataset.
1 What is the probability that a random person selected is female? It is the total # of female persons divided by all persons, which gives us 0.6. (am not putting out the code as this is just very basic stuff). Conversely, the ‘complement rule’ as it is called means the probabilty of someone being male is 0.4. This can be computed as 1 – 0.6 or total # of men /total in sample. Since being both male and female is not possible, these two events can be considered mutually exclusive.
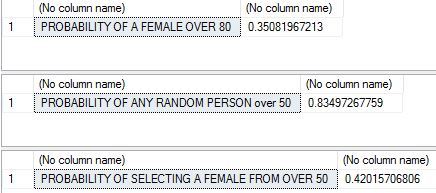
2 Let us look at some conditional probability. What is the probability that a female is selected given that you only have people over 50? The formula for this is probability of selecting a female over 50 divided by probability of selecting someone over 50.
DECLARE @COUNT NUMERIC(8, 2), @COUNTFEMALE NUMERIC(8, 2),@COUNTMALE NUMERIC(8, 2)
SELECT @COUNTFEMALE = COUNT(*) FROM [dbo].[WHO_LifeExpectancy] WHERE GENDER = 'female' and AGE > 50
SELECT @COUNT = COUNT(*) FROM [dbo].[WHO_LifeExpectancy]
SELECT 'PROBABILITY OF A FEMALE OVER 80' , @COUNTFEMALE/@COUNT
SELECT @COUNTMALE = COUNT(*) FROM [dbo].[WHO_LifeExpectancy] WHERE age > 50
SELECT @COUNT = COUNT(*) FROM [dbo].[WHO_LifeExpectancy]
SELECT 'PROBABILITY OF ANY RANDOM PERSON over 50' , @COUNTMALE/@COUNT
SELECT 'PROBABILITY OF SELECTING A FEMALE FROM OVER 50', @COUNTFEMALE/@COUNTMALE

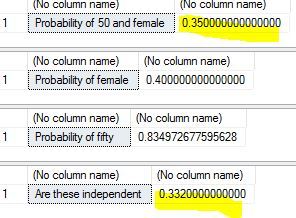
3 Do we know if these two events are dependent or independent of each other? That is , is does selecting a female over 50 affect the probability of selecting any person over 50? To find this out we have to apply the formula for independence – which is that the probability of their intersection should equal the product of their unconditional probabilities..that is probability of female over 50 multiplied by probability of female should equal probability of female and 50.
DECLARE @pro50andfemale numeric(12, 2), @total numeric(12, 2), @female numeric(12, 2), @fifty numeric(12, 2)
select @pro50andfemale= count(*) from [dbo].[WHO_LifeExpectancy] where age > 50 and gender = 'female'
select @total = count(*) from [dbo].[WHO_LifeExpectancy]
select 'Probability of 50 and female' ,round(@pro50andfemale/@total, 2)

select @female = count(*) from [dbo].[WHO_LifeExpectancy] where gender = 'female'
select 'Probability of female', @female/@total
select @fifty = count(*) from [dbo].[WHO_LifeExpectancy] where age > 50
select 'Probability of fifty', @fifty/@total
select 'Are these independent ', round((@female/@total), 2)*round((@fifty/@total), 2)
Results are as below..as we can see, the highlighted probability #s are very close suggesting that these two events are largely independent.

From the next post am going to look into some of these concepts with R and do some real data analysis with them. Thanks for reading.


