Baselines can be any set of metrics that have been recorded to give you an understanding of what is the norm. Having a baseline gives you another piece to the puzzle when troubleshooting performance issues. It is the “base” that is used as a comparison to highlight areas of performance degradation.
We are all aware how important it is to baseline our SQL Servers right?! We all take regular baselines of our SQL Servers right?! For some reason I’m guessing there is quite a high percentage of people who were thinking wrong to at least one of the above statements. Why do I say that? Well in October 2012 Paul Randal carried out a survey on baselines and posted the results here. I was surprised to see not only that more people did not have baselines than did, but also the reasoning for not having a baseline. In my opinion there is no excuse for not taking baselines, after all it doesn’t take much time or effort to create a baseline to capture only the most significant SQL Server metrics. My stance on this is firm but fair; if you’re a DBA and you are not taking baselines then you aren’t doing your job to the best of your abilities! Still don’t agree? Erin Stellato did a fantastic article over at SQL Server Central on Capturing Baselines on Production SQL Servers. With this you don’t even need to write anything, it is a simple copy and paste job with some familiarisation of the routine. Go on, take a look and give it a go and I’m sure you will see the value when the gremlins get into your environment and you’re frantically trying to find the problem.
Understanding how to measure performance allows you to analyse the impact on your environments the decisions you've made have had, while also assisting you with future decisions. Too many times I have seen decisions being made incorrectly, myself included, because of a lack of information. Without a full picture it is impossible to be sure the decision you are about to make is correct. Basically what I am getting at is the more information about your environments you have at your disposal the better the chance of you making the right decisions. It is worth mentioning at this point I don’t mean go and collect every single performance counter in perfmon and or all the meta-data information in the DMV’s. The key is to find the right metrics for your environments.
The main area that most people measure is the performance of the SQL Server itself, including both Windows (perfmon) and SQL Server (DMV’s). While this information is invaluable to have not many people measure the performance of the databases, specifically the associated code within SQL Server and the applications that abuse it. In this post I am going to provide one way which I have used over the years to give me a representation of the performance of the statements being run against a server.
Below are just a few things over the years I have used baselines for;
• Give me a representation of “normal” performance
• Troubleshoot performance issues
• Capacity Planning
• Monitoring the Impact of an application release
Recently however I used a baseline for something completely different; to show some of the benefits that SQL Sentry Performance Advisor would give us as a DBA team in our day to day roles. For those of you not familiar with SQL Sentry, the products they offer, in particular Performance Advisor I suggest you head over to their website here. In summary;
“Performance Advisor for SQL Server provides unparalleled insight, awareness and control over the true source of SQL Server performance issues. Performance Advisor is packed with ground-breaking features that aren’t found in any other performance monitoring software, all designed with the singular goal of simplifying the process of SQL Server performance tuning and optimization”.
Performance Advisor comprises of a Monitor Service which monitors one or more SQL Server Instances a Repository Database which requires SQL Server and a client application for viewing the collected trace data.
For the purposes of this post I will protect sensitive information by replacing names etc. The environment I have configured is as below;
ServerA
This Server runs the SQL Sentry Performance Advisor Monitor Service and SQL Sentry repository database. This server also runs an instance of Reporting Services that a small reporting solution is deployed too.
ServerB
This is a production SQL Server that is monitored by SQL Sentry Performance Advisor.
To configure this environment you will also need a minimum of two servers as above. Below is a breakdown of the process.
Configure ServerA
Install SQL Sentry Performance Advisor and monitor at least one instance of SQL Server.
Create the baseline routine
While Performance Advisor is “doing its thang” create the routine to aggregate the trace data and produce our baseline.
Take the initial baseline
This is simple leave Performance Advisor to run for 7 days monitoring ServerB, don’t react to or change anything that is not business critical during this time to ensure results are as accurate as possible.
Analyse the initial baseline
The initial baseline will be based on 7 days of trace data, analyse this data based on the baseline routine created.
Tune, Tune, Tune
Spend the next 7 days performance tuning as you see fit based on the picture that Performance Advisor has painted.
Take the second baseline
Once you are happy with the amount of tuning you have done take the second baseline. My advice here is that you align the initial and second baselines to start and end on the same weekday and time. I start on Monday at 00:00 and end on Sunday at 23:59:59.
Compare the initial and second baselines
Compare the results of the initial and second baselines.
NOTE – This routine has been developed and deployed to SQL Server 2008 R2 and has not been tested on any other version. Although every care has been taken to ensure it works with SQL Server 2008, 2008R2 and 2012, I cannot guarantee it.
The routine can be found here to download and implement.
Configure ServerA
As I mentioned earlier this Server will run the Monitor Service and also house the SQL Sentry repository database. The SQL Sentry Quick Start Guide will detail how to install and configure Performance Advisor. The trial is for 15 days however this baseline exercise may last for 21-28 days depending on the length of the tuning process. Alternatively you could reduce the period that the initial and second baselines are captured for so the entire process fits within the 15 days. The reason I used 7 days is that there are processes that run over the weekend which I wanted to capture, tune and compare. The SQL Sentry team are very good, they offer some of the best vendor support I have ever received, I would suggest speaking to them if you need to extend the trial beyond the 15 days. Once Performance Advisor is installed and configured on ServerA to monitor ServerB you are ready to move onto the next step.
There is a ReadMe.txt in the DatabaseScripts folder that details a few requirements, but the scripts are pretty straight forward to follow.
The routine aggregates data and records the SpeedIndex (this is the metric used throughout the routine) for different intervals. One of the intervals Business Day is defined in the routine as 08:00 to 22:00, this is specific to my current employer and if this does not reflect your business day you will need to update this in 3 of the scripts and save the files before running them.
Update the 2 - CreateDatabaseObjects.sql script;
There are three instances of 08:00 and 22:00 in this script.
Update the 3 - InsertLookupTableData.sql script;
There is one instance of 08:00 and 22:00 in this script.
Update the 4 - CreateJobs.sql script;
There are two instances of 08:00 and 22:00 in this script
There is also a stored procedure used by the Reporting Solution in 2 - CreateDatabaseObjects.sql script that uses REPLACE to remove the trailing domain from the server name. This will need updating to your domain if you also want to remove the trailing domain for neatness. There are two instances of .YourDomain.Here in 2 - CreateDatabaseObjects.sql that you will need update accordingly. For example if your domain was sql365.local then you would replace .YourDomain.Here with .sql365.local
Create the baseline routine
To create the baseline routine you will need to run 4 scripts in the DatabaseScripts folder, in order, which I have listed below;
1 - CreateITInternalDatabase.sql
2 - CreateDatabaseObjects.sql
3 - InsertLookupTableData.sql
4 - CreateJobs.sql
A list of the objects created by the scripts is below;
1 x Database
ITInternal
3 x Schemas
Archive
Kpi
Reports
6 x Tables
Archive.tblSpeedIndexByMinute
Archive.tblSpeedIndexSummary
kpi.tblLookupServerName
kpi.tblLookupSpeedIndexDescription
kpi.tblSpeedIndexByMinute
kpi.tblSpeedIndexSummary
16 x Stored Procedures
Archive.spArchivetblSpeedIndexByMinute
Archive.spArchivetblSpeedIndexSummary
kpi.spGetInfoForInsertSpeedIndexByMinute
kpi.spInsertSpeedIndexByMinute
kpi.spInsertSpeedIndexSummary
kpi.spInsertSpeedIndexSummaryMoreThanOneDay
kpi.spShowPerformanceSpeedIndex
kpi.spShowPerformanceSpeedIndexMoreThan1Day
Reports.spGetAverageSpeedIndexForCurrentMonth
Reports.spGetMaxSpeedIndexSummaryCurrentBusinessDay
Reports.spGetServerName
Reports.spGetSpeedIndexByDay
Reports.spGetSpeedIndexByMinuteCurrentBusinessDay
Reports.spGetSpeedIndexDescription
Reports.spGetSpeedIndexSummary
Reports.spGetSpeedIndexSummaryYesterday
8 x Jobs
(00:30) - Insert Speed Index For Last 24 Hours
(22:30) - Insert Speed Index For Last Business Day
(Every 5 Minutes) - Insert Speed Index For Last 5 Minutes
(Every Hour) - Insert Speed Index For Last Hour
(Every Minute) - Insert Speed Index For The Minute
(Mon 01:00) - Insert Speed Index For Last Week
(Monthly) - ArchiveSpeedIndexByMinuteData
(Monthly) - Insert Speed Index For Last Month
Once the scripts have been run, you can then deploy the Reporting Services Solution. The solution is in the ReportingServicesSolution folder and comprises of;
2 x Data Sources
ITInternal
SQLSentry
2 x Shared Data sets
ServerName
SpeedIndexDescription
3 x Reports
SpeedIndexByDay
This shows a 30 day representation of the SpeedIndex for a given server.
SpeedIndexCurrentBusinessDay
This shows a one day representation of the SpeedIndex for the current day along with the SpeedIndex for;
Max 5 Min Period
Max 1 Hour Period
Last 24 Hours
SpeedIndexForBusinessDay – Email
This is the same as SpeedIndexCurrentBusinessDay but has an added date parameter, I use this for historical checks and also for subscriptions hence the Email in the title.
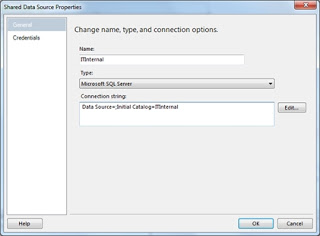
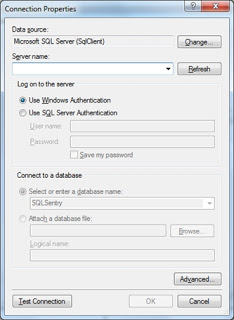
Both Data Sources need to be set to use the server that you configured earlier (ServerA);
Double click each Data Source and at the Shared Data Source Properties window (see below) click Edit.
At the Connection properties window (see below) type the server name you have used as ServerA and click OK.
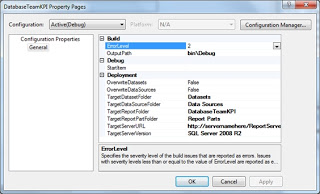
The only other thing to change is to update the Deployment Settings to point to the Report Server instance and path where you want to deploy the reports and of course deploy the solution.
To do this right click DatabaseTeamKPI top level in solution explorer (see below) and select properties;
The TargetServerURL needs to be updated to reflect the server you want to house the reports. If this is different to ServerA then the servernamehere will need to reflect this. Once amended, simply right click DatabaseTeamKPI again and select Build, then right click DatabaseTeamKPI one last time and click deploy.
The routine and reports are now setup; it is time to take the initial baseline.
Take the initial baseline
Not too much to do here, the SQL Agent jobs created by the database scripts will aggregate the trace data collected by Performance Advisor and create the baseline. You can view the data collected by querying the tables or using the reports in the reporting solution, to familiarise yourself with the routine while the initial baseline is being collected so you can hit the ground running with the analysis.
What I suggest here is that you export the SpeedIndexByDay report once a day for use when comparing the two baselines. This is not an essential as the data the reports use is still record so can be used historically.
Analyse the initial baseline
The SpeedIndex is the figure we are using here, the lower the better, however each environment will be different so you will have to use your own judgement as to what is acceptable in your environment. I’ve included a summary of the how the SpeedIndex is calculated below;
SpeedIndex = ((QueryHitCount * QueryAverageDuration / 1000000) * 420 / Duration of Aggregation)
Tune, Tune, Tune
The SQLSentryPerformance.sql file contains two queries that both return the SpeedIndex and the most expensive queries run against ServerB. The first will be run against data between two dates the second will be run against data between two times on the same day. The second result set that contains the queries will give execution duration and read / write data. I would take the top 25 – 50 queries and tune them. Now when I say tune this can vary dramatically from removing an order by or adding an index, to completely refactoring a query. SQL Sentry Plan Explorer that ships with Performance Advisor is invaluable here to help identify expensive operators in the execution plans.
Take the second baseline
Not too much to do here, the SQL Agent jobs created by the database scripts will aggregate the trace data collected by Performance Advisor and create the baseline.
NOTE – Do not make any changes during this period that are not business critical. This will help improve the accuracy of the baselines and the impact of the tuning.
What I suggest here is that you export the SpeedIndexByDay report once a day for use when comparing the two baselines. This is not an essential as the data the reports use is still record so can be used historically. Another piece of advice that I mentioned earlier is that you align the initial and second baselines to start and end on the same weekday and time. I start on Monday at 00:00 and end on Sunday at 23:59:59.
At my current employer we were able to achieve a 40% – 50% reduction in the SpeedIndex KPI during one week of tuning.
Compare the initial and second baselines
Another simple task here, compare the SpeedIndex values of the initial and second baselines. How in depth you want to go here is entirely up to you. The lowest level of granularity for the SpeedIndex that the routine captures is 1 minute.
This routine has proved extremely valuable and the impact visible not only to the DBA team but to the IT management team. So much so that off the back of this and a few other bells and whistles that Performance Advisor provides, we were approved to purchase the required licenses of Performance Advisor to monitor our core SQL Server clusters!
I hope this post gives you an insight into the importance of baselines and the role they play in the day to day monitoring of your SQL Servers. I also hope that the routine allows you to gain in my eyes “another valuable metric” and a means by which to “Sell” SQL Sentry Performance Advisor to your management team as a truly fantastic tool which gives you so much more than just the data that the routine uses.
As always, Enjoy!
Chris


